Posts with tag: property prices

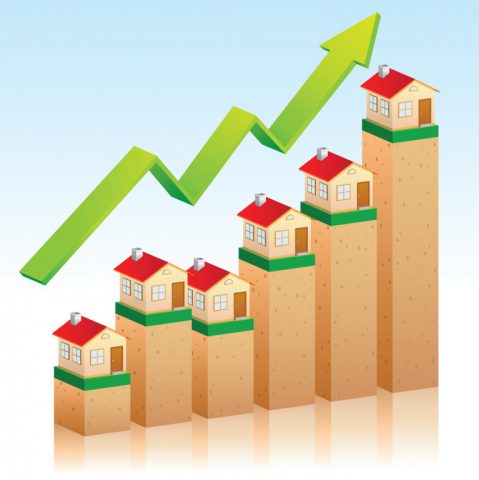
Property prices up by 0.6% in June

Published On: July 14, 2016 at 10:14 am

Author:

Categories: Property News

Tags: ,,,

Latest data released by LSL reveals that the average price of a property in England and Wales rose by 0.6% during June. This comes as a welcome break following three consecutive months of falling house price values, including a 0.9% drop in May.

Rise and falls

This said, property prices in the capital fell by 1.4% month-on-month, the largest drop seen since May 2011.

Across England, year-on-year prices have risen by 6%, with the typical house sale amounting to £293,444. The East of England saw the largest increase of 9.4%.

What’s more, sales in the three months to June increased by 8% in comparison to the same period in 2015. Of course, these figures were driven up by investors surging to beat the additional Stamp Duty deadline on April 1st.

During June 2016, roughly 72,000 sales were completed, 13% lower than in 2015, but up on the 55,250 figure seen in May 2016.

Property prices up by 0.6% in June

Property prices up by 0.6% in June

Brexit consequences

Adrian Gill, director of Your Move and Reeds Rains, has suggested that the Brexit result will bring with it wide ranging consequences for the housing market.

Gill observed, ‘exactly how the implications will play out in the sector over the coming months is yet to be seen and whilst London is likely to feel the effects more acutely, it is important to remember that the outlook is not all doom and gloom. Already lower interest rates promised by the Bank of England to stave off any slowdown are set to ease affordability and support prices.’[1]

‘What is clear is that the impact of April’s Stamp Duty increase has now largely played out, and there’s little evidence to suggest it has significantly hit investor appetite: first time landlords seem no less common and there’s new interest in mixed commercial and residential purchases, such as flats over shops that escape the increase. Ultimately, with interest rates set to remain lower for longer, the Bank of England reducing banks’ capital requirements and changes in Government imminent, the short-medium term outlook for the housing market could well remain positive after all,’ Gill added.[1]

[1] http://www.propertyreporter.co.uk/property/june-house-prices-see-a-06-rise.html

East of England property prices soaring

Published On: June 23, 2016 at 9:42 am

Author:

Categories: Property News

Tags: ,,

Concerns are being raised over the sustainability of the property market in the East of England, as house prices continue to rise in the region at a quicker rate than anywhere else in the UK.

Home.co.uk’s Asking Price Index indicates that property prices in the area have risen twice as fast as the rest of the country during the past year.

Rising values

Between June 2015 and June 2016, values in the East of England have risen by 13.9% in comparison to the average of 6.8% in England and Wales and 6.7% in Scotland.

The rise recorded in the East of England is far greater than the 7% seen in London over the same period.

Analysis of asking price figures for May and June 2016 further underline how the East of England has become the sharpest market in the UK. In this monthly period, the regions asking prices increased by 1.6%. London’s fell by 0.4% and prices in the South East only rose by 0.2%

England and Wales as a whole saw a rise of 0.4%.

East of England property prices soaring

East of England property prices soaring

Fastest selling region

Properties are also selling quicker in the East of England than in any other region. The average time on the market for homes in the area is 54 days, in comparison to 80 days in England and Wales as a whole.

Lack of supply is a key reason in variations in asking price by region. There was an 8% drop in supply of property in the East of England between May 2015 and May 2016. In the same period, the UK-wide drop in supply was 7%.

In comparison, property supply in Greater London rose by 2% and by 1% in the South East.

Doug Shephard, director of Home.co.uk, said, ‘a cooling London market has changed the dynamic of the UK property market and is now less of a focus for property investors. The new regional champion is by far the East of England where terrific price rises look set to rival even London in its heyday.’[1]

[1] http://www.propertyreporter.co.uk/property/are-prices-rising-too-fast-in-the-east-of-england.html


Who Would Win the Euros Based on Property?

Published On: June 13, 2016 at 11:37 am

Author:

Categories: Property News

Tags: ,,,

With the Euros kicking off last week, online estate agent eMoov.co.uk has taken an alternative look at how the teams match up from a property point of view.

eMoov has compared each team in the tournament based on the cost of living in each country, rather than how good their players are. It has taken the average take home pay after tax, property price per square foot, the cost of monthly utilities and (keeping with the sports theme), the cost of a monthly gym membership in each country.

The analysis began with some good news for England fans, with the country offering the best take home pay after tax across all teams. But that’s as far as it goes for the team, as England is home to the highest property price per square foot, at a huge £10,464. The tournament’s other worst offenders where house prices are concerned are Switzerland (£8,160), Sweden (£5,199) and France (£4,274).

eMoov ranked each team by awarding goals for the following:

  • One goal was awarded to the team with the highest take home salary.
  • One goal was awarded to the team with the lowest average house price.
  • One goal was awarded to the team with the lowest utility cost per month.
  • One goal was awarded to the team with the lowest gym membership cost per month.

The results for each group are as follows:

Group A 

Despite a substantially lower take home income when compared to France and Switzerland, Albania and Romania top the group with seven points each. Both offer significantly lower property prices per square foot (below £1,000), and Albania’s extremely low cost of living across the board sees them top of the set.

Who Would Win the Euros Based on Property?

Who Would Win the Euros Based on Property?

France isn’t too far behind Romania where the cost of living (other than property price) is concerned, and despite just one win for the group, the country did enough to secure one of the third place qualification spots.

Although Switzerland offers the best take home income by far, at £3,850, the cost of property per square foot and gym membership are more than double that in France, meaning Switzerland comes out with no points.

Group B 

Unfortunately, but predictably, England put in a disappointing performance in the group and fails to make it through, or even score a point. Despite a higher take home income, England is also home to the highest cost of living when compared to the rest of the group.

With two wins and a draw, England’s neighbours Wales tops the group with seven points.

Russia takes second place with five points, doing enough for automatic qualification, while Slovakia claims third place with four points.

Group C 

The biggest shock of the tournament is that Germany leaves the Euros without scoring a single point. Despite a higher take home income, Germany’s property price and utilities are considerably higher. However, they lost out by just £0.69 to the next highest team in terms of gym membership, Northern Ireland.

Although they missed out on automatic qualification to Poland, Northern Ireland managed to sneak through as another third place qualifier, with the Ukraine and Poland qualifying with nine and four points respectively.

Group D

Turkey and the Czech Republic automatically qualified for the next stage after scoring points for the lowest utility bills and low property prices.

However, Spain and Croatia both made an early exit. Spain had the second lowest utility costs out of the group, although its high property prices let it down, at £2,107 per square foot.

Group E 

Belgium sailed through with ease into the next round, having the lowest property price, gym membership and second lowest utility bill cost of the group. Additionally, although the country’s cost of living is low, its average monthly income is the third highest of the group, making Belgium a firm favourite to win the tournament!

However, it’s not such good news for Italy, which came bottom of the group, if not the entire tournament. Although the country’s property prices, utility bills and gym membership costs are the highest within the group, its average wage is the lowest.

Group F 

Austria’s vastly higher property prices and utility costs put them out of the tournament with just one point. Despite a low take home pay, Hungary’s cheaper house price sees them top the group with five points, along with Portugal, which has the lowest utility costs of the set.

Iceland made it through as the final third place qualifier, although, despite a high take home income, they are likely to exit in the next round due to high property prices and gym membership costs.

The founder and CEO of eMoov, Russell Quirk, says: “With another major tournament comes the build up and hype of England’s potential chances, and there is an underlying feeling that this revamped team could go some distance. It’s likely that football’s world powers will prevail again, with the likes of Spain, Germany and France making the final stages, so we thought we would take an alternative look at how the teams match up.

“It’s interesting to see how each team scores when it comes to the cost of living and how they match up with others in the tournament. A higher property price doesn’t necessarily translate to a high cost of living across the board – Sweden has a property price per square foot of over £5,000, but at £60 a month, the utility costs are one of the lowest in the tournament. On the flip side, the take home income in Italy is the lowest in Group E, but the cost of living is very expensive.”

He adds: “It’s unlikely that our research will mirror real life, apart from England’s early exit perhaps, but it will be interesting to see who makes it through from out last 16 to the group stages in a few weeks.”

House price growth stays static in May

Published On: June 7, 2016 at 11:48 am

Author:

Categories: Property News

Tags: ,,,

The most recent Halifax house price Index has revealed that the average property price in Britain has remained static during the last three months to May.

According to the report, the average price of a home in the UK remained at 9.2% in the last month. This was the same as in April and is the lowest level for the last six months.

House price growth levels

Further data from the analysis suggests that property values in the three months to May were 1.4% greater than what they were in the preceding three months. This was just below the 1.5% seen to April and the lowest since November 2015.

Martin Ellis, housing economist, said, ‘house prices in the three months to May were 1.4% higher than in the previous quarter. The annual rate of growth was unchanged at 9.2%; the lowest since last autumn. Low interest rates, increasing employment and rising real earnings, continue to support housing demand. The strength of demand, combined with very low supply, is causing house price to rise at a brisk pace in quarterly and annual terms.’[1]

‘Increasing affordability issues, caused by a sustained period of higher-than-earnings house price growth, should curb housing demand and result in some slowdown in house price growth as the year progresses.’[1]

House price growth stays static in May

House price growth stays static in May

Remarkable resilience

Ian Thomas, co-founder and director of LendInvest, said, ‘the resilience of house price growth is remarkable. Even now, that the Stamp Duty stampede of the first quarter is behind us and with the uncertainty of the EU referendum result dampening activity, house prices are still holding up. Demand continues to outpace supply; there simply aren’t enough houses being built. The latest disappointing housebuilding stats make this abundantly clear. The Government’s dream of one million new homes by 2020 simply isn’t realistic without a fundamental change of approach.’[1]

Concluding, Mr Thomas noted, ‘as a result, house prices will continue to rise. Investors will continue to enjoy great returns from putting their money into property, while aspiring home buyers face a tricky time getting the sums to add up in order to move up the housing ladder.’[1]

[1] http://www.propertyreporter.co.uk/finance/house-price-growth-remains-static.html


ONS figures show changing face of UK housing market

Published On: April 7, 2016 at 12:01 pm

Author:

Categories: Property News

Tags: ,,,,

Interesting data released by the Office of National Statistics (ONS) shows the economic downturn has shifted the demographic of home ownership in Britain.

Results from the latest economic review report from the ONS show the proportion of households who privately rent their home increased sharply following the downturn.

Surge

Those renting from a private landlord increased from 6% to 11% in the twenty years from 1988 to 2008. However, there was then a jump to 16% in the six years to 2014.

In contrast, the proportion of households owning their property increased slowly from 56% to 71% between 1981 and 2008. This figure then fell to 67% by 2014.

The fall in homeownership, coupled with the rise in private renting, reversed a three-decade trend of increasing numbers of home owners. The ONS report shows that this partly reflects tighter mortgage lending and the performance of house prices during the recovery period.

What’s more, the report shows that these features have assisted in cutting the fraction of households owning their own home with a mortgage. This has fallen from 43% in 1991 to only 31% in 2014.

Trends

While trends in homeownership have begun to reverse, the impact on specific groups of the population have been greater. The number of people choosing to stay living with their parents for longer has increased substantially, with patterns in tenure amongst independent property owners also altering.

Numbers of young people living in privately rented accommodation have risen massively both since the economic downturn and in the last decades. In 1987, only 9% of people aged between 26-30 rented. However, this figure increased to 19% by 1997, 30% by 2007 and 39% in 2014.

Nearly one-third of those aged between 31-35 privately rented accommodation in 2014, with one in five people aged between 37 and 41 renting.

ONS figures show changing face of UK housing market

ONS figures show changing face of UK housing market

Fall in ownership

A recent rise in private rentals has been driven by the sharp fall in home ownership and the lower number of mortgages being taken out. Between 1977 and 1987, individuals living in a property with a mortgage increased. However, in the next two decades, the proportion of young people of these properties decreased, but the mortgage owning population between 45 and retirement age increased. This reflects that many purchasers between 1977-87 were youngsters who had now matured.

Differences recorded between 2007 and 2014 are alarming. The report highlights the prevalence of mortgagors is presently lower than in 2007 for every age group below 55.

It shows that the increase of private rentals has been particularly noticeable amongst 21-25 year olds. Proportions of renters in this age group increased from less than 20% in the 1980’s to over 60% in 2014. Smaller percentages of these groups live in mortgaged homes than in any time since records began.

Rent by regions

In London, rent accounted for 34% of disposable income for renters during 2014, in comparison to just 15% for those in the North East. The South East and West saw ratios of renters above 25%, with the East Midlands, Yorkshire and the Humber and Northern Ireland below 20%.

According to the report, the figures reflect movements in the prices of rent across regions. Rents in the capital and South East have become unaffordable, while those in the North are much cheaper.


House prices up by 2.9% in Q1 of 2016

Published On: April 7, 2016 at 10:50 am

Author:

Categories: Property News

Tags: ,,,,

Data released today indicates that the average UK house price now stands at £214,811, with annual property value growth hitting 10.1%.

The report from the Halifax also shows that average property values rose by 2.6% in March, in comparison to the previous month. What’s more, prices in the first quarter of 2016 were 2.9% greater than those recorded in the last three months of 2015.

Annually, the rate of growth increased from 9.7% to 10.1%-the greatest yearly increase since the three months to July 2014.

Rush

Observers suggested that the rush of buy-to-let investors striving the beat the Stamp Duty increases deadline contributed significantly to driving prices up.

However, there could well be a lull in price rises over the next two months. Martin Ells, Halifax housing economist observed, ‘worsening sentiment regarding the prospects for the UK economy and uncertainty ahead of the European referendum in June could result in some softening in the housing market over the next couple of months.’[1]

Howard Archer, chief UK and European economist at business research firm IHS, also noted, ‘post April, a likely warning of buy-to-let and second home interest may modestly dilute housing market activity and ease upward pressure on prices.’[1]

House prices up by 2.9% in Q1 of 2016

House prices up by 2.9% in Q1 of 2016

Spiralling demand

Long term, house prices are very likely to continue to rise, with demand outstripping supply in the majority of regions.

Mr Ellis added, ‘current market conditions remain very tight with an acute supply/demand imbalance continuing despite an improvement in the number of properties coming onto the market for sale in recent months. This, together with continuing low interest rates and a healthy labour market, indicate that house price growth is set to remain robust.’[1]

By property type, prices of flats have risen more markedly than any other since 2008, rising by 57% over the period. This was in comparison to 37% for residential property as a whole. Detached homes having risen by 20% in the same timeframe, with terrace and semi-detached houses recording rises of 38% and 34% respectively.

[1] http://www.theguardian.com/money/2016/apr/07/uk-house-prices-pick-up-pace-101-annual-increase-halifax-brexit?utm_medium=twitter&utm_source=twitterfeed