Posts with tag: property price rises

How do iPhone price rises compare to that of UK housing in the last decade?

Published On: September 12, 2017 at 12:01 pm

Author:

Categories: Property News

Tags: ,,,

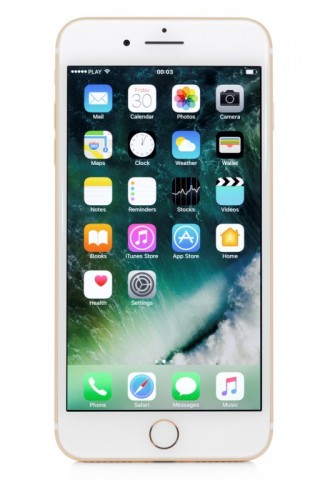
Today is set to see the latest version of the iPhone announced to the public, in Apple’s latest conference scheduled for this evening.

The model is expected to retail at a cool $969 (£734), meaning the price has risen by 94% since the original iPhone came onto the market in January 2007.

But just how does this staggering rise compare to that of the housing market during the same period?
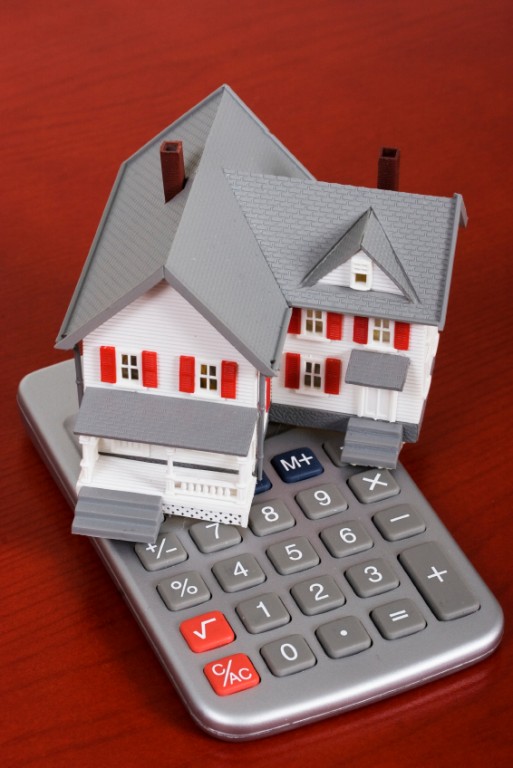
Price Rises

Well, there is no comparison, with prices in the UK housing market rising just 26% on average over the decade.

However, both have seen a fall in price in the last 10 years, with the iPhone 3G (June 2008), 3GS (June 2009) and 4 (June 2010) all seeing a lower price point of $299 when introduced.

In addition, the typical UK house price also dropped between June 2008 and June 2009, by roughly -12.25% as a result of the economic crash.

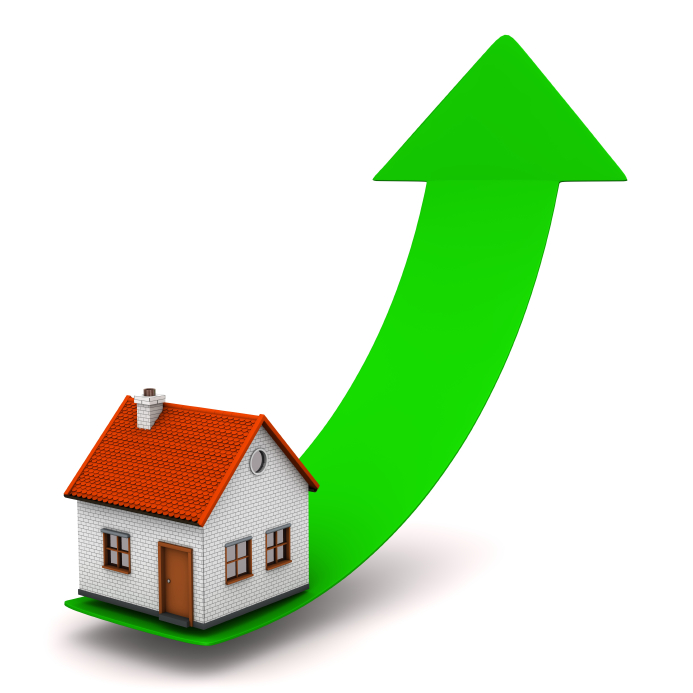
Since then, the UK market has enjoyed steady growth across each annual Apple iPhone release announcement. Whilst Apple kept their prices frozen at $399 between 2011 and 2013, there has been a notably-larger price rise in the UK housing market.

From March last year, when Apple announced the iPhone 7 and 7S, property prices have risen by 8%.

How do iPhone price rises compare to that of UK housing in the last decade?

How do iPhone price rises compare to that of UK housing in the last decade?

Costs

Russell Quirk, founder and CEO of eMoov.co.uk, commented: ‘The escalating cost of getting on the UK property ladder is one that is often highlighted, alongside the lack of growth where wages are concerned and the increasing cost of living.’

‘It makes it even harder for those of us loyal to the iPhone cult when each year the latest product released escalates at an extraordinary rate. It highlights the impossible task faced by younger generations in terms of keeping up with two fast paced areas of modern life, property, and technology.’[1]

[1] http://www.propertyreporter.co.uk/property/how-much-has-price-increases-of-iphone-outstripped-the-uk-housing-market.html


Which regions have seen the highest property price rises in 2016?

Published On: November 30, 2016 at 10:08 am

Author:

Categories: Property News

Tags: ,,,

With the end of the year on the horizon, home services marketplace Plentific has released it’s 2016 Property Price Index. This gives an overview of how Britain’s house prices have performed during the last 12 months and has revealed some surprising results.

Property price rises

The study has indicated the top ten best and worst performing regions in terms of property price fluctuations.

Aylesbury led the way, with the average price of a home rising by an eye-watering 21.5% over the course of the year.

It appears that prices in new commuters hotspots have risen substantially, with Aylesbury thriving as a result. In fact, the top-ten is dominated by regions in London and the South East.

Greenwich (+19.91%), Hammersmith (+17.46%) and Chelsea (+18%) all represented the top-ten in London. Meanwhile, St Albans (+17.28), Sutton (+17.39%), Reading (+16.9%) and Brentwood (+19.43%) are other commuter regions that saw a surge in values.

The full top ten list is:

Town Dec 2015 Average Sold Price Current average value (2016) Change % Change £
Aylesbury £314,236 £381,787 21.50% £67,551
Greenwich £509,710 £611,169 19.91% £101,459
Ipswich £221,805 £265,267 19.59% £43,462
Brentwood £447,220 £534,094 19.43% £86,874
Chelsea £1,836,338 £2,166,805 18.00% £330,467
Hammersmith £875,132 £1,027,929 17.46% £152,797
Sutton £396,757 £465,750 17.39% £68,993
St Albans £511,418 £599,772 17.28% £88,354
Reading £380,989 £445,375 16.90% £64,386
Wirral £197,244 £229,950 16.58% £32,706

[1]

Which regions have seen the highest property price rises in 2016?

Which regions have seen the highest property price rises in 2016?

North/South divide

The Index reveals a distinct North/South divide, with only the Wirral representing the North in the top-ten locations for house price growth.

However, there are a number of northern regions among the worst performers, including Rotherham (+3.48%), Salford (+3.08%) and Bradford (+2.99%).

Bottom of the list though is Westminster, with values actually falling by 3.67% over the period. Demand in prime central London has seen substantial falls, with Westminster taking the brunt of the lower interest.

The worst performing regions were found to be:

Town Dec 2015 Average Sold Price Current average value (2016) Change % Change £
Highland £166,542 £174,898 5.02% £8,356
Stoke-on-Trent £137,048 £143,924 5.02% £6,876
Newquay £252,426 £262,010 3.80% £9,584
Rotherham £142,032 £146,975 3.48% £4,943
Hackney £580,438 £599,139 3.22% £18,701
Salford £150,820 £155,462 3.08% £4,642
Bradford £124,921 £128,655 2.99% £3,734
St Ives £333,669 £334,376 0.21% £707
Middlesbrough £145,812 £143,448 -1.62% -£2,364
Westminster £1,247,719 £1,201,932 -3.67% -£45,78

Stephen Jury, spokesperson for Plentific, noted: ‘Our report shows the winners and losers in property this year. More importantly, it gives valuable insight to those wanting to get onto the property ladder or invest in property in areas with good potential for price increases.’[1]

‘We have found a fifth of homeowners carry out home improvements to increase the value of their property. Buying a renovating a fixer-upper in the right area will increase the value significantly, so this is worth considering when hunting for property,’ he added.’[1]

[1] http://www.propertyreporter.co.uk/property/2016-property-price-index-reveals-whats-hot-and-whats-not.html


Price-gap between London and other cities growing

Published On: September 25, 2015 at 4:26 pm

Author:

Categories: Landlord News

Tags: ,,

According to the latest house price index from Hometrack, the gap between house prices in London and other major regional UK cities is at its largest for 20 years.

Increases

Property prices in the capital saw a 4.6% growth in the three months to August and a 10% over the past year. Overall city house prices in Britain rose by 8.3%, up from 6.6% in May. A similar rise has been recorded in sales volumes, which have been translated into higher prices across major UK cities.[1]

The largest rate of growth was in Cambridge at 11.2%, with the lowest being in Aberdeen, where prices have dropped by 2%. In comparison to one year ago, price inflation has risen in five cities, led by Edinburgh with 9%, followed by Glasgow, where growth is running at 5.3%.[1]

‘City level house prices continue to increase as demand for housing grows in the face of constrained supply,’ noted Richard Donnell, director of research at Hometrack. ‘A changing mix of buyers is compounding the scarcity of housing for sale with rising numbers of first time buyers and investors buying property while having nothing to sell. Only a recovery in the number of moves amongst existing home owners or an increase in new supply will ease the current housing scarcity which seems unlikely in the near term,’ he continued.[1]

Price-gap between London and other cities growing

Price-gap between London and other cities growing

Over-valued

Mr Donnell went on to say that, ‘the gap between house prices in London and other major regional cities is at its widest level for 20 years. This highlights a seemingly over valued London market, on a price/earnings basis and the prospect of further price growth to come in the large regional UK cities.’[1]

‘London’s price earnings ratio is at an all-time high while there remains value in most other regional cities. The pricing differential to London could well assist city regions attract new investment as the cost of housing starts to influence decision making for both households and businesses,’ Donnell concluded.[1]

[1] http://www.propertywire.com/news/europe/uk-cities-property-prices-2015092511021.html


Average UK house price exceeds £200,000

Published On: July 8, 2015 at 10:46 am

Author:

Categories: Property News

Tags: ,,

Unaffordability fears have heightened with the news that the average cost of a home in Britain has soared to over £200,000 for the first time.

According to the latest report from the Halifax, the growth in value of residential property rose for the fourth consecutive month in June to now stand at £200, 280. This means that property prices have grown higher than the £199,612 recorded during the economic boom in August 2007.[1]

Growth

The Halifax report shows that the annual growth rate has risen from 8.6% in the year to May, to 9.6% in the 12 months to June. This is the highest rate of inflation recorded since September 2014.[1]

‘House prices in the three months to June were 3.3% higher than in the preceding three months,’ noted Martin Ellis, the Halifax’s chief housing economist. ‘This measure of the underlying rate of house price growth picked up following two successive falls.’[1]

Ellis continued by saying, ‘supply remains very tight with the stock of homes available for sale currently at record low levels. This shortage has been a key factor maintaining house price growth at a robust pace so far in 2015.’ He feels that, ‘economic growth, higher employment, increasing real earnings growth and very low mortgage rates are all supporting housing demand with signs of a recent modest pick-up in demand.’[1]

Sales

Despite stock remaining low and with mortgage constraints hindering buying, the study also showed that the total number of homes sold increased during the last month by 1% to 98,540.[1]

What’s more, sales during the last quarter of the year were up 0.5% on the first three months, but were 4.2% down on the same time twelve months ago.

Across the country, house prices per square metre were found to have increased by 18% since 2010, from an average of £1,719 to £2,033 in 2015. Greater London has seen the fastest growth in Britain, with an average increase of 45%. The South East came next with a rise of 22%.[1]

Average UK house price exceeds £200,000

Average UK house price exceeds £200,000

Stunning

Economist Howard Archer went as far to say that the Halifax report was, ‘a bit of a stunner.’ He continued by saying, ‘latest data and survey evidence indicate overall that housing market activity is on the up. Additionally, reduced uncertainty following May’s general election appears to have given a lift to buyer interest.’[1]

‘Nevertheless, the upside for housing market activity and prices is expected to be constrained by more stretched house price to earnings ratios, tighter checking of prospective mortgage borrowers by lenders and the likelihood that interest rates will start rising gradually from the first quarter of 2016,’ Archer added.[1]

[1] http://www.telegraph.co.uk/finance/property/11725547/House-prices-crash-through-the-200000-ceiling.html


Worst Housing Shortage for Four Decades

Published On: June 11, 2015 at 3:43 pm

Author:

Categories: Landlord News

Tags: ,,,

Property price growth in the UK accelerated for the fourth consecutive month in May, as the shortage of homes for sale hit the worst level in around four decades, a study revealed.

The Royal Institution of Chartered Surveyors (RICS) said that its price gauge rose to 34 from 32 in April. Economists at Bloomberg had expected a reading of 36. In London, the measure leapt

Worst Housing Shortage for Four Decades

Worst Housing Shortage for Four Decades

to the highest in almost a year.

Price rises were fuelled by the continuing pressure on supply that many estate agents expected to see improved after the Conservative general election win.

Chief Economist at RICS, Simon Rubinsohn, says: “There had been some hope that the removal of political uncertainty would encourage more properties onto the market, but the initial indications are that this is not proving to be the case.

“It is hardly surprising that prices across much of the country are continuing to be squeezed higher, with property set to become ever more unaffordable.”1

Property sales were down 14% in May from the previous year, LSL Property Services and Acadata discovered in a separate report. The average house price in England and Wales rose 0.4% to a record £277,178, up 4.5% on the year earlier.

Estate agent Adrian Gill comments: “The general election did ruffle some feathers, but as we return to smoother ground, it’s becoming clear that there’s a more structural problem holding back the market and that the lack of properties on the market is starting to choke off activity. Price rises will only speed up if housing supply doesn’t put pedal to metal.”1

In May, the price index for London increased to 27% from 24% in April, RICS uncovered. The expectations measure for the next three months also grew to 49 from 12.

Aside from the South East of England, the strongest price growth is forecast for the North West, which is expected to benefit from George Osborne’s northern powerhouse plans to devolve powers to the region.

1 http://www.bloomberg.com/news/articles/2015-06-10/u-k-house-price-growth-quickens-as-supply-shortage-intensifies

Average cost of homes under £300,000 in 3 London boroughs

Published On: June 5, 2015 at 10:11 am

Author:

Categories: Property News

Tags: ,,

Just three London boroughs have property prices with an average of less than £300,000, according to new figures from the Land Registry. All of these boroughs are either in the east or south-east of the capital.

Capital gains

The report suggests that only Barking and Dagenham and Newham in the east, plus Bexley in the south-east, are areas where average property prices stand below the £300,000 mark.

Of these regions, Newham showed the highest annual increase of 17.2%, which took the average cost of homes in regions such as West Ham and Canning Town to £295,306. Hackney recorded the largest monthly rise of all London regions, with the average price of a property in the area now £616,004.[1]

Figures from the report show that the average cost of a property in London has risen to £474,544.

Average cost of homes under £300,000 in 3 London boroughs

Average cost of homes under £300,000 in 3 London boroughs

Rises

Moreover, regional sales figures for the whole of England and Wales in April show that London boasted the highest price rises during the last 12 months, with an annual increase of 10.9 per cent.[2]

Average house prices in England and Wales saw an increase of 5.1% during the last year and now stand at £179,817.[3]


[1] http://www.homesandproperty.co.uk/property-news/news/london-house-prices-new-land-registry-figures-reveal-average-cost-buying-london-home-reaches-almost