Just two areas have seen house price growth that is slower than the drastically falling prime central London market.
The biggest property price growth in the capital is now in more affordable areas.
Luxury London homes once kept the housing market stable, with values rising by 86% since hitting a low in 2009, revealed Hometrack.
The prime central London market grew by just 1.6% in the past since months, putting it in the bottom three of the house price index.
The only areas with slower growth were Dundee at 0.1% and Sunderland at 0.7%.
Prices have dropped in the last year in some of the most exclusive postcodes of London. They fell by 7% in Knightsbridge, 1% in Chelsea and 0.8% in Kensington.
Some areas that experienced stronger growth than prime central London were Middlesbrough, Rochdale and Grimsby.
Worst areas for house price growth
|
Area
|
House price growth in last year
|
| Dundee |
0.1% |
| Sunderland |
0.7% |
| Prime central London |
1.6% |
| Plymouth |
1.7% |
| Telford |
1.9% |
| Middlesbrough |
2% |
| Blackpool |
2.3% |
| Swansea |
2.5% |
| Blackburn |
2.6% |
| Rochdale |
2.7% |

Just 2 Places Have Slower House Price Growth than Prime London
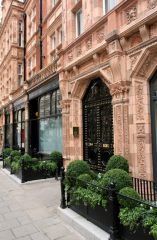
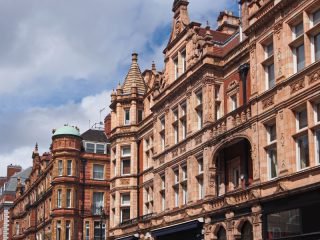
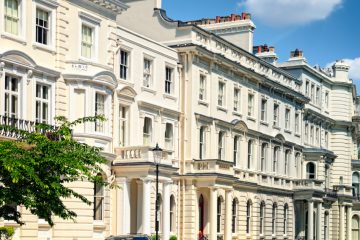
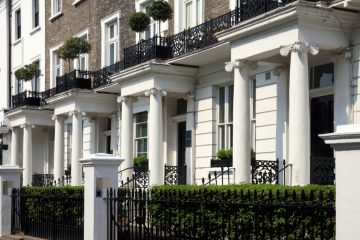
Hometrack has identified prime central London as the most expensive international market in the capital, containing just over 100,000 or 3% of London’s homes in areas such as Chelsea, Belgravia, Knightsbridge, Mayfair, Marylebone, Hampstead and Kensington.
However, average prices in these locations are still 55% higher than they were at the 2007 peak, now at a staggering £1,044,250.
Contrastingly, all other areas in the bottom ten have experienced house price decreases since the peak.
Richard Donnell, Hometrack’s Research and Insight Director, says that tax changes, such as Stamp Duty reform, have affected the most expensive properties and put buyers off.
He continues: “Last year, George Osborne introduced some tax changes – higher levels of Stamp Duty, overseas investors have to pay Capital Gains Tax [CGT]. There were concerns about the mansion tax and sterling started to appreciate.
“There’s still overseas demand, but rather than looking like a red-hot buy, people have started to question whether it can keep going up.”
Instead, Donnell observes that growth is “coming out of the cheapest parts of London.”
He specifies: “At the moment, it’s places like Newham, Barking and Dagenham and in the commuter areas, places like Watford. They are the ones that are keeping the momentum going in our London city index.”
The new data also indicates a continued north-south divide, with all of the fastest growing areas for house prices located in the south, especially near London.
Top ten areas of house price growth
|
Position
|
Area |
House price growth in last year
|
| 1 |
Luton |
13.1% |
| 2 |
Oxford |
12.3% |
| 3 |
Milton Keynes |
11.4% |
| 4 |
Reading |
11.3% |
| 5 |
Crawley |
11.2% |
| 6 |
Bristol |
10.9% |
| 7 |
Brighton |
10.1% |
| 8 |
London |
10.1% |
| 9 |
Southend-on-Sea |
10% |
| 10 |
Medway |
9.9% |
Donnell advises buyers to search for markets with growing levels of employment and earnings, “markets just outside the great M25 area, where there’s value for money in housing.”
He adds: “It’s going to continue to be your Aldershots, your Crawleys, the Medway towns – affordable and accessible markets around London will continue to increase.”1
Big cities such as Manchester, Birmingham and Leeds are experiencing increases in new jobs, which will also push up prices, says Donnell.
1 http://www.telegraph.co.uk/finance/property/house-prices/11790634/Just-two-places-where-house-price-growth-was-slower-than-luxury-London.html


