Posts with tag: London

New HMO licensing rules could impact London’s biggest rental market

Published On: October 13, 2021 at 8:40 am

Author:

Categories: Landlord News,Law News

Tags: ,,,

Research by central London estate agency Bective has revealed how new HMO licensing rules will impact London’s biggest rental market, Westminster.

The new rules came into force in Westminster at the end of August 2021. They state that shared houses or flats where 3 or more people from 2 or more households share facilities now require licensing as HMOs (houses in multiple occupation). This is in replace of the rule that stated an HMO license wasn’t mandatory until 5 or more people were sharing facilities.

Bective’s research highlights that Westminster is the largest private rental market in London, where private rental stock accounts for 27% of all dwellings. In Westminster, this number rises to 42% of dwellings, followed by the City of London (41%) and Kensington & Chelsea (37%).

Top 10 boroughs ranked top to bottom for private rent as % of total stock

LocationPrivate rental % of total stock
Westminster42.1%
City of London41.1%
Kensington and Chelsea37.2%
Newham36.0%
Tower Hamlets34.5%
Hammersmith and Fulham33.0%
Haringey32.7%
Wandsworth32.4%
Camden31.8%
Brent31.0%
London26.80%
Source – ons.gov.uk

Westminster also has the 6th largest number of existing HMOs (9,539) of all London boroughs, trumped only by Ealing (20,429), Brent (16,984), Lambeth (12,000), Tower Hamlets (10,000), and Enfield (10,000).

Over the past three years, Westminster has seen the 8th largest increase in the number of HMOs, up 19% between 2017 and 2020, behind Hillingdon (668%), the City of London (614%), Lambeth (532%), Tower Hamlets (67%), Newham (58%), Waltham Forest (53%), and Harrow (36%).

Total number of HMO properties in London boroughs in 2017 and 2020, ranked from biggest 3-year increase to smallest

LocationEstimate of total number of HMOs 2016 to 2017Estimate of total number of
HMOs 2019 to 2020
3 year change
Hillingdon6515,000668%
City of London14100614%
Lambeth1,90012,000532%
Tower Hamlets6,00010,00067%
Newham6,0009,50058%
Waltham Forest3,9005,95153%
Harrow8801,20036%
Westminster8,0009,53919%
Greenwich6,5007,50015%
Hackney4,2694,71710%
Brent16,00016,9846%
Hounslow1,8001,8503%
Havering2652671%
Sutton1,2001,2000%
Ealing20,42920,4290%
Kingston upon Thames4,8004,8000%
Barnet5,9305,9300%
Croydon3,0003,0000%
Camden8,0008,0000%
Kensington & Chelsea4,4344,000-10%
Bromley2,3002,074-10%
Bexley1,4001,200-14%
Redbridge5,0004,000-20%
Enfield14,20010,000-30%
Barking & Dagenham300192-36%
Haringey12,0006,000-50%
Hammersmith & Fulham6,6333,000-55%
Lewisham14,8106,000-59%
Southwark13,0005,020-61%
Merton5,5682,040-63%
Richmond upon Thames51097-81%
Wandsworth15,000820-95%
IslingtonN/A400 
London overall194,693172,810-11%
Sources – Gov.uk LA Housing Data,Gov.uk LA Housing Statistics

Westminster also ranks 12th in terms of current HMO numbers as a percentage of all rental stock (18%), a list that is topped by Ealing (53%), Brent (46%), and Enfield (32%).

HMOs as a percentage of private rental stock in top 20 London boroughs, ranked from largest percentage to smallest

LocationEstimate of private
rentals (2019)
Estimate of total number of HMOs 2019 to 2020HMOs as % of private rental stock
Ealing38,90420,42952.5%
Brent37,28316,98445.6%
Enfield31,05110,00032.2%
Greenwich25,1917,50029.8%
Kingston upon Thames16,3704,80029.3%
Lambeth42,24512,00028.4%
Tower Hamlets41,88510,00023.9%
Camden33,6258,00023.8%
Hillingdon22,0295,00022.7%
Newham42,1249,50022.6%
Waltham Forest28,0595,95121.2%
Westminster52,7919,53918.1%
Lewisham33,2776,00018.0%
Haringey35,7816,00016.8%
Redbridge26,3364,00015.2%
Southwark35,0395,02014.3%
Barnet42,2355,93014.0%
Hackney34,1004,71713.8%
Kensington and Chelsea32,6704,00012.2%
Hammersmith and Fulham29,3993,00010.2%
London overall963,794172,81017.9%
Sources – Gov.uk LA Housing Data,ONS

However, with these changes now in force, Bective points out it is likely the number of HMOs within the borough will now spike.

Tom Dainty, Head of Lettings and Property Management at Bective, comments: “The impact of these new rules will be two-fold. Yes, it’s undeniable that additional HMO licensing and tighter scrutiny when dealing with rule-breakers will benefit tenants by raising the standard of living.

“But, at the same time, this increased scrutiny, along with the additional costs, might tempt landlords to up sticks from Westminster and find more profitable investments elsewhere.

“This exodus will be of detriment to tenants. Less landlords means less stock, and less stock means higher rent prices. With Westminster’s average rent already more than £2,600 a month, this could further price more tenants out of the borough.”

East London rental yields top of the charts for second quarter of 2021

Published On: June 28, 2021 at 8:06 am

Author:

Categories: Landlord News

Tags: ,,

East London currently offers the best rental yields in the capital, according to research from Portico.

The London estate agent has found that the area of Abbey Wood in East London has experienced an influx of investors buying up affordable properties to let near the train station, thanks to the arrival of the Crossrail. It believes that the availability of 12 fast central London trains every hour has significantly bolstered this area’s growth. This puts Abbey Wood at the top for the best rental yields throughout London for Q2 of 2021, at an impressive 6.7%. The highest yield in the area can be found along Yarnton Way to the east.

The agent reports that properties in the area of Dagenham Road are also benefiting from a proposed national rail service to Fenchurch Street Station in under 20 minutes. With easy access to Lakeside, Romford, and the A13, this area suits commuters and lifestyle seekers. The rental yield in this area is at 6.3% for Q2 of 2021.

Third spot for this quarter goes to the east London area of Creekmouth. Portico says the area is producing a strong rental yield of 6%, despite being largely known for its industrial estate.

East London, Top Yields 
Abbey Wood (East Yarnton Way)6.7%
Dagenham Road, Beam River6.3%
Creekmouth6%
Barking5.9%
Little Heath5.8%
Upney5.8%
Across the rest of the capital, north London’s Ponders End and Freezywater in Enfield both offer a rental yield of 5.7%.
North London, Top Yields 
Ponders End, Enfield5.7%
Freezywater, Enfield5.7%
Edmonton, Enfield5.6%
Edmonton Green, Enfield5.5%
Enfield Wash, Enfield5.4%
Northumberland Park (Tottenham)5.2%
The best rental yields in the west can be found in Hayes and Harlington (5.2%). In the south, Eastfields is top at 5.8%.
West London, Top Yields by Neighbourhood
Hayes and Harlington5.2%
Northolt (Specifically West of Northolt Station)4.9%
Uxbridge4.7%
Hayes & Harlington Station4.7%
North Cheam4.7%
Hayes End / West Drayton4.6%
South London, Top Yields 
Eastfields, Manor Way5.8%
Mitcham4.9%
South Beddington4.9%
Thornton Heath4.7%
Coulsdon4.6%
Whyteleafe South4.6%

Buy-to-let hotspots across the capital are viewable on Portico’s rental yield map.

Sophie Durkin (MNAEA, MARLA), Portico Regional Director, says: “Thanks to the vaccination roll-out, Britain has been finally enjoying some return to normalcy. Rental demand has remained healthy and rental yields have consistently demonstrated a promising recovery through the past two quarters. Landlord instructions are also up 12% year-on-year, and tenant registrations have increased by a significant 22% from January 2021 to May 2021.

“Our latest rental yield research shows that there are certainly some healthy rental yields to be found in London – especially in areas experiencing significant regeneration and of course, those areas set to benefit greatly from Crossrail. East London is still the leading buy-to-let hotspot – and, as lockdown restrictions continue to ease, we expect demand from tenants to increase.”

Transport links still adding value to London house prices despite pandemic

Published On: June 11, 2021 at 8:03 am

Author:

Categories: Lettings News,Tenant News

Tags: ,,

There is a £46,800 premium in London for property 500m from the nearest station, compared to a similar property 1,500m (1.5km) away, research from Nationwide shows.

London has seen its house price premium increase to 9.7% from 8.6% in 2019/20. Comparatively, Manchester has seen a drop to 6.1% from 9.0% in the same period.

Glasgow has seen the biggest increase in premium at 7.2%, up from 3.5% in 2019/20.

Andrew Harvey, Nationwide’s Senior Economist, comments: “We’ve analysed how the proximity to either a metro or railway station has impacted property prices in London, Manchester and Glasgow, after taking account of other property characteristics, such as type, number of bedrooms and local neighbourhood. This latest report is an update of the feature we published in 2019 (available to view online). Our analysis is based on transactions in the period April 2020 to March 2021, and which should therefore incorporate any shifts in housing preferences as a result of the pandemic.

“London homebuyers still appear willing to pay a significant premium for being close to a station compared with those in Glasgow and Greater Manchester. This probably reflects the greater reliance on public transport in the capital, with residents less likely to drive.

“The pandemic does not appear to have reduced the desirability of being close to a station in London, despite reduced public transport usage. Indeed, our analysis suggests the premium has actually increased slightly compared with pre-pandemic levels.

“We’ve also seen a noticeable increase in the premium to be located close to a station in the Greater Glasgow area, but in Greater Manchester, homebuyers appear to be placing a little less value on being close to a rail or tram stop compared to before the pandemic.”

Londoners still pay a significant premium to live near a tube or train station

Harvey continues: “Our research indicates that homebuyers in the capital continue to pay a significant premium to be close to a station. A property located 500m from a station attracts a 9.7% price premium (approximately £46,800 based on average prices in London) over an otherwise identical property 1,500m from a station. 

“The illustration in the attached shows the price premium for similar properties at various distances from a tube or railway station (relative to a property 1,500m away). As you might expect, the premium buyers are willing to pay increases as you move closer towards a station. A property located 1,000m away commands a 4.3% premium, at 750m this increases to 6.8%, while a property 500m from a station attracts a 9.7% premium.

“Our analysis suggests that there has actually been a slight increase in station premiums in London compared with pre-pandemic levels. In 2019-20, a property located 500m from a station attracted an 8.6% premium over a comparable property 1,500m from a station.

“It would appear that those buying in the capital continue to value accessibility to rail and tube links. And while public transport utilisation remains well below pre-pandemic levels, TfL reports that the re-opening of shops, pubs and restaurants has helped boost Tube usage.”

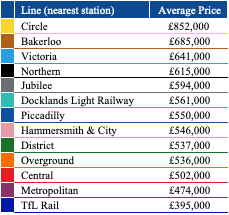
Which line is associated with the highest house prices?

Harvey comments: “The Circle line serves the capital’s most expensive areas taking in much of central London and also parts of west London.  Average house prices are around £850,000 in areas where the nearest station is on the Circle line. 

“Of all the London Underground lines, average house prices are least expensive where the nearest station is on the Metropolitan line.  This probably reflects that it stretches towards the outer suburbs, with only a short section in central London.

“The lowest average house prices amongst TfL served routes are currently found where the nearest station is operated by TfL Rail, ahead of the introduction of Crossrail services. TfL currently runs services from Liverpool Street to Harold Wood (and onward to Shenfield in Essex) and from Paddington to Heathrow Airport (via Ealing) and also to West Drayton (and onward towards Reading in Berkshire).

“The lower prices for TfL Rail may reflect that most of these stations are outside of central London and that delivery of the Crossrail project remains behind schedule.”

Increase in premium for rail links in Glasgow

Harvey comments: “Glasgow has the largest network of suburban railway lines in the UK outside of London. Within the Greater Glasgow area there are around 155 railway stations with a further 15 subway stations in Glasgow city centre. 

“Interestingly, it appears that homebuyers are now willing to pay a greater premium to be close to a railway or subway station compared with the pre-pandemic period.

“Our research suggests homebuyers in 2020-21 paid a 7.2% price premium (approximately £11,400 based on average prices in the region) over an otherwise identical property 1,500m from a station. This compares with a 3.5% (£5,200) premium based on those buying in 2019-20.

“It is perhaps surprising that the premium for transport links in Scotland’s largest city has increased despite the reduction in public transport usage. But it would appear to suggest that those who are buying do still value these links and expect to use them again in the future.

“Indeed, pre-pandemic, Glasgow and the surrounding area saw a much higher proportion of people using trains to travel to work than other parts of Scotland.

“The districts best served by the network include Glasgow City, Inverclyde and West Dunbartonshire, where around 90% of properties are within 1.5km of a station. Both the latter contain many of Glasgow’s commuter towns and villages and are well connected by the main railway lines skirting the River Clyde.

Tram & rail links in Greater Manchester attract premium amongst homebuyers

Harvey comments: “Greater Manchester is served by an extensive network of railway and tram lines. Recent years have seen a further expansion of the Metrolink network to Manchester Airport and the opening of the ‘Second City Crossing’ and most recently the Trafford Park line.

“Our research suggests that while homebuyers are still willing to pay a premium to be close to either a Metrolink or railway station, this has fallen since the onset of the pandemic.

“A property located 500m from a station attracts a 6.1% price premium (approximately £11,000 based on average prices in the region) over an otherwise identical property 1,500m away.

“Our analysis suggests this has fallen from pre-pandemic levels when the premium was as high as 9.0% (based on transactions in 2019-20). While we can’t be certain why the premium has fallen, it is possible that priorities for homebuyers in the Greater Manchester area have changed during the pandemic, with a greater emphasis placed on things like local amenities and access to outdoor space.”

Is build to rent now the dominant force in London’s new build sector?

Published On: June 4, 2021 at 7:55 am

Author:

Categories: Landlord News,Property News

Tags: ,,

Build to rent specialist Ascend Properties has seen an increase in build to rent properties being completed in London during the past year.

In Q1 2020, there were 1,600 completions, while in Q1 2021, there were 1,809 completions, a rise of 13%.

Comparing the success of London build to rent during the pandemic with the success of the wider new-build sector during the same time period, Ascend has found the data suggests Build to Rent is becoming the go-to choice for developers in the capital.

It states that while in London new build completions as a whole fell by -10% during the pandemic, the number of build to rent completions rose by almost 60%.

Ged McPartlin, Managing Director of Ascend Properties, comments: “This data shows, without question, that build to rent is now the premier choice for London developers. While the pandemic has brought about a marginal decline in build to rent completions at a national level, the sector has gone from strength to strength within the capital and now accounts for a far greater proportion of all new build completions.

“This is hardly surprising as build to rent lends itself perfectly to the mixed-use development schemes that are fast becoming a key focus for London developers and local authorities, who are looking to revive demand in urban areas that have suffered since people stopped commuting into work.

“It’s often the case that unexpected global events turn long-term visions into immediate actions – this is the case with COVID and build to rent. Build to rent was always destined to dominate the long-term vision of developers and residents alike, but the pandemic has now expedited that process of evolution.”

Latest quarterly build to rent completions
Location2020 – Q12020 – Q42021 – Q1Quarterly ChangeAnnual Change
London1,6001,6291,80911.0%13.1%
Regions2,0221,8261,447-20.8%-28.4%
UK3,6223,4553,256-5.8%-10.1%
Data sourced from BPF.org.uk
      

Note: The below data on pandemic build to rent completions (Table 1) includes the latest sector data for Q1 2021 (above). Therefore, the pandemic timeline includes five quarters of completion data and (Q1 2020 to Q1 2021), and compares to the previous five quarters (Q4 2018 to Q4 2019).

Table 2 shows how these completions compare to new build transactions. However, as the latest available data for new build transactions is Q4 2020, the timeline reflects this with a year on year look to give an accurate comparison. Q1 2021 build to rent completions have not been included, which is why the totals differ from those in Table 1.

Table 1 shows the change in build to rent completions since the pandemic compared to the same time period previous
LocationBefore pandemicSince pandemicDifferenceDifference %
London5,7677,3711,60427.8%
Regions10,2886,896-3,392-33.0%
UK16,05514,267-1,788-11.1%
Time Period(2018 Q4 to 2019 Q4)(2020 Q1 to 2021 Q1)  
Data sourced from BPF.org.uk
     
       
Table 2 shows the change in build to rent completions since the pandemic compared to the same time period previous
SectorBefore pandemicSince pandemicDifference
London New Build Completions21,28019,110-2,170
London Build to Rent Completions3,5285,5622,034
Time Period(2019 Q1 to 2019 Q4)(2020 Q1 to 2020 Q4) 
Data sourced from BPF.org.uk (BTR) and Gov.uk (New Build)

Where to find London’s cheapest 2 bedroom rental properties

Published On: June 2, 2021 at 8:26 am

Author:

Categories: Lettings News,Tenant News

Tags: ,,,

New research reveals the cheapest and most expensive boroughs in London for renting a 2 bedroom property.

London estate agent Portico has found that rental rates have been dropping during the pandemic, with central London rents down by 13%.

Examining 26,417 rental properties in all 32 London boroughs currently available on Rightmove, it has identified the most affordable locations for tenants.

The research shows that the average rental price in the capital is currently £1,832 per month, while the average rental for a two-bedroom property in the capital is £1,800 per month.

The following table shows a ranking of all 32 London boroughs from cheapest to most expensive. The boroughs have been ranked by their average 2 bedroom rental prices.

London BoroughNumber of 2 bedroom propertiesAverage Rental Price 2 bed (pcm)
Bexley73£1,243
Sutton96£1,313
Croydon377£1,341
Hillingdon284£1,375
Barking and Dagenham123£1,377
Bromley175£1,400
Redbridge212£1,404
Harrow302£1,428
Waltham Forest193£1,458
Lewisham326£1,483
Enfield153£1,490
Kingston upon Thames167£1,551
Barnet385£1,575
Haringey346£1,602
Ealing355£1,642
Greenwich431£1,653
Brent377£1,667
Newham381£1,667
Hounslow364£1,689
Merton279£1,701
Lambeth382£1,885
Hackney366£1,912
Islington380£1,938
Richmond upon Thames378£1,949
Tower Hamlets382£1,975
Southwark427£2,051
Wandsworth454£2,121
Hammersmith and Fulham395£2,179
Camden368£2,257
Westminster351£2,921
Kensington and Chelsea412£3,100
City of London113£3,284

Robert Nichols, CEO of Portico estate agents, says, “As life begins to return to something a lot more like normal, tenants seem to be making their first post-pandemic moves. Renter registrations are already up a staggering 44% from this time last year. It seems only a matter of time before balance is restored in the market, which will undoubtedly represent some very welcome news for landlords throughout the capital.

“The current snapshot is likely to prove temporary. Along with being an excellent time to rent, it could also be a window of opportunity for first-time investors or those seeking to expand an existing property portfolio. While it’s evident the pandemic has distorted the market, it seems there are lingering effects. With recovery imminent, some of the boroughs that wouldn’t ordinarily offer such bargains may just be lagging behind unfolding events. For tenants and investors alike, that might represent a once in a lifetime chance.”

The full research from Portico can be read here: https://www.portico.com/blog/tenant-advice/the-cheapest-places-to-rent-in-london

Highest rental growth in ten years recorded for three England regions and Wales

Published On: May 25, 2021 at 8:14 am

Author:

Categories: Landlord News

Tags: ,,,,

UK rent prices have increased by 3.0% in the last year but dropped by 9.4% in London, according to the latest UK Rental Market Report from Hometrack.

The report states that there is strong rental demand amid constrained supply across the UK outside of London. The North East, South West, East Midlands and Wales have seen the highest rental growth since March 2011.

Hometrack predicts there will be an increase in demand for rental homes in city centres as offices start to reopen.

Terry Mason, Group Operations Director at the UK’s largest rental guarantor service, Housing Hand, comments: “We’ve seen renters in London and other cities head to the suburbs in search of cheaper property while working from home. Many tenants simply waited until their current contract ran out and then headed out of the city centre to save money. Others moved back in with their parents while working from home, making huge savings.

“A few companies have saved money too. Let’s say a typical office desk costs around £750 per month. That’s £15,000 per month for a 20-person team. A company that reduces its requirement to 10 desks can add £90,000 per year straight to its bottom line. While those with long leases don’t have much room for manoeuvre, businesses using flexible office space have gained enormously.

“Of course, if staff are less productive working at home, then those gains are reduced. Some staff are more productive at home; others in the office. Many companies, however, still favour those who are able and willing to work in an office environment.

“As such, it makes sense that demand for rental homes in city centres is likely to pick up once more. Rents now being so much cheaper in many central locations, following the past year of reduced demand, is likely to feed into this too. Tenants can save quite substantially compared to what they were paying pre-pandemic, as we see highlighted by the 9.4% drop in rents in London. I believe all of this points to an uptick in demand, which we will see play out over the remainder of this year and into 2022.”

Read Hometrack’s full report here: www.hometrack.com/uk/insight/rental-market-report/q1-2021-rental-market-report/