Posts with tag: London

Rogue Landlords be Warned: Database Enables London Boroughs to Name and Shame

Published On: May 25, 2018 at 9:27 am

Author:

Categories: Landlord News

Tags: ,

The mayor of London, Sadiq Khan, has set up a new database for boroughs to submit records of successful prosecutions and fines of rogue landlords and letting agents.

All 33 London boroughs have now signed up to be a part of it. This means that landlords or letting agents who have been prosecuted or fined across the capital will now be publicly accessible on an online database. In addition to the public side of the database, local authorities will also be able to access certain records which cannot be viewed publicly, but which are available for local law enforcement authorities to help crack down on living conditions in the capital.

The database is primarily designed for protecting private renters in London, enabling them to check up on landlords and letting agents before they enter into tenancy agreements.

As it currently stands, ten boroughs have now submitted their reports, with the rest expected to follow shortly. The first six boroughs to sign up to the scheme were Newham, Brent, Camden, Southwark, Kingston and Sutton.

One record that has already gone up is of a landlord in Westminster, who was fined £150,000 after a major fire took place in a block of flats they owned.

The database is accessible here, on the City Hall’s website.

Rogue Landlords be Warned: Database Enables London Boroughs to Name and Shame

New database enables private renters to access information regarding rogue landlords and agents

Sadiq Khan Comments

Sadiq Khan says, “When I launched the checker I made it clear unscrupulous landlords and agents would have nowhere to hide. Now, with all local authorities signed up, we have reached an important milestone in protecting London’s renters.

“The rental market in the capital is difficult enough to navigate without a small minority of rogue operators exploiting their tenants. This tool will empower Londoners to make an informed choice about where to live.

“I’m extremely grateful for the support of all the local authorities and other bodies which have signed up to contribute their records to the database. I’m confident this will be a major step in tackling unscrupulous and illegal practices in the rented sector.”

In addition to this new database, Khan has also launched a property portal on City Hall’s website, which advertises affordable homes to rent or buy in the capital. This accompanies the Shared Ownership home search, which provides prospective London buyers with a way to get onto the initial step of the property ladder.

Khan continues, “I refuse to stand by as thousands of Londoners suffer sky-high rents and horrendous living conditions in a city they call home.”

Residential Index for London: May 2018 Key Findings

Published On: May 23, 2018 at 9:04 am

Author:

Categories: Property News

Tags: ,

The residential index came about from what the London Central Portfolio (LCP) has addressed as ‘a number of conspicuous issues’ with existing industry data. Published monthly, the index has revealed certain figures for Prime Central London, Greater London and England and Wales.

Key findings for Prime Central London

  • Average prices exceed £2m for the fourth month running
  • Average prices have fallen back for the second consecutive month, after an all-time high in January
  • Quarterly transactions stand at 975, the lowest level since Additional Rate Stamp Duty was introduced in 2016
  • New build transactions have fallen 14.9% year on year

Naomi Heaton, CEO of LCP, comments: “Average prices in Prime Central London (PCL) remain above the £2m mark in March for the fourth consecutive month. This has been largely due to the sale of 14 flats in the Holland Park Villas development between £10 and £33 million each, since November of last year.

“The wait and see attitude of both investors and property owners continues throughout the PCL market. There is therefore very limited stock available and most current vendors need to sell. Consequently, there are some very good opportunities for the few buyers in the market.”

Key Findings for Greater London

  • Monthly prices in Greater London fell by 1.4%
  • Average prices now stand at £629,024
  • Quarterly sales stand at 20,283, following a 12.3% fall, which is the lowest figure since April 2011
  • New build sales dropped for the fifth consecutive month to 15,950
  • Average new build prices stand at £647,570

Heaton says, “as primarily a domestic market, the continuing falls in transactions in Greater London is extremely concerning. This is attributable to caps on mortgages, a lack of affordable housing and the economic uncertainty around Brexit. A loss in buyers’ confidence may result in a further slide in prices and transactions.”

Key Findings for England and Wales

  • Monthly prices in England and Wales dropped by 0.9%
  • Excluding Greater London, prices stand at £255,912
  • New build transactions fell by 0.7% over the year, to 104,748
  • The new build premium compared to existing stock sits at 16.6%

Heaton comments, “the most significant figure in this month’s report is that England and Wales has seen a 21.5% drop in quarterly sales. This is the fifth consecutive fall in transactions, suggesting that England and Wales as a whole is now suffering a lack of confidence and a disconnect between buyer and seller expectations.

“With a lack of certainty in the economic outlook for the domestic homeowner, we would not expect this trend to change until Prime Minister May provides more clarity on post-Brexit Britain. It seems that both first time buyers and second steppers are putting

their purchase decisions on hold for the time being.”

Heaton comments on the creation of the Residential Index: “The LCPAca Residential Index has been established to address a number of conspicuous issues with existing residential indices. Samples offered by high-end estate agents tend to be small and non-representative.

“Nationwide’s HPI represents just 12 per cent of the market, excludes cash purchases and is based on mortgage approvals not actual sales. Rightmove use asking prices data only, whilst RICS Residential Market Survey is largely qualitative. Land Registry’s own published full report is based on a restricted sample, excludes new builds and has a longer time lag.

“Looking to overcome these problems and provide a single reliable residential index, our new report, based on every sale transacted through Land Registry, will provide a much more accurate and in-depth analysis on how the market as a whole, including the controversial luxury and new build sectors, have really fared in Prime Central London, Greater London and England and Wales.”

Find the May 2018 report in full here.

London and South East Create Strong Start to the Year for Buy to Let Market

Published On: May 11, 2018 at 9:09 am

Author:

Categories: Landlord News

Tags: ,

According to data from Commercial Trust, the specialist buy to let broker, the BTL market in London has seen a strong start to the year. This is after a reasonably quiet final quarter of 2017.

This latest report shows the rise in mortgage applications from BTL investors, with it being the first increase since the second quarter of last year. The data shows an increase from 12.4% in Q4 of 2017, to 16.5% in Q1 of 2018.

Overall, we can see that top of the table for growth is still the South East, with an individual market share increase from 17.2% in Q4 2017, to 19.2% in Q1 of 2018.

However, looking at the biggest improvement within the market, the East Midlands is the clear winner, which saw a 5% escalation during the first three months of the year.

Progress has also been made within Scotland and Wales over the same period, with an increase of almost 2%.

Andrew Turner, chief executive at Commercial Trust Limited, has commented: “From our latest quarterly data, it is clear that property investment in London and the South East is very much alive and kicking – and if anything, growing.

“The report perhaps also reflects the effect of the introduction of the 3% stamp duty surcharge in April 2016, which of course would have been more keenly felt by investors in the more expensive properties found in this part of the country.

“London and the South East remain regions of high demand for rental property and a recent article from City AM indicated that property prices in the capital have continued to fall, perhaps creating something of a buyers’ market for investors.

“I think the data also reflects a regained sense of confidence in London and the South East, among landlords with capital to spend.

“Similarly, the North West continues to see significant infrastructure investment and projects like HS2 will have the potential to further enhance opportunities for economic development in the long term. This in turn may attract more businesses, creating jobs, migration and further rental demand, whilst at the same time potentially contributing to property price growth.”

London House Price Averages are Distorting Reality, Expert Warns

Published On: May 10, 2018 at 9:48 am

Author:

Categories: Property News

Tags: ,

The average house prices that are reported for Greater London in various industry indices are distorting what is actually happening on the ground, according to property expert Kate Faulkner.

“The figures for London this quarter are kind of astonishing,” Faulkner begins. She explains that, since 2000, the capital has been used to recording house price growth of 7-8% every year.

Since 2009, when most parts of the UK saw house prices at their lowest due to the recession, growth for some has been 100% over just ten years, meaning double-digit annual increases for many.

“Yet now, the property price picture couldn’t be more different,” Faulkner claims.

She notes that all indices have recorded year-on-year house price declines in London, albeit by small amounts when compared to recent growth, although the price falls appear to be hitting apartments more than the short supply of houses, with detached house prices still growing at just over 3% per year, matching inflation.

Faulkner acknowledges that this will be good news for many, as buyers can have some “rare respite” and take their time to purchase a property, as well as make “a cheeky offer”, while any homeowner who purchased before 2016 will still have seen “phenomenal growth in prices”, even if they bought at the height of the market in 2007/08.

“The current losers will be those who have bought over the last few years at the current height of the market and may now have seen their property values fall,” Faulkner adds. “This, though, is only an issue for a fraction of people who are forced to sell for whatever reason.”

It’s the distortion that Greater London house prices averages are having on the market that is most concerning to Faulkner.

She explains: “For those areas which have seen huge growth over the last ten years, such as the likes of Hammersmith & Fulham, as well as Tower Hamlets, prices are seeing falls of over 5%. Although this doesn’t seem like a big deal for most, with average house prices of £500,000+, this gives the media their scary headlines of Londoners having £25,000 or more wiped off the value of their home. However, it’s all relative, and for those who bought a few years ago, this will be nothing compared to the gains they have made since the credit crunch hit.”

Faulkner points to Hometrack’s latest index, which shows that, although 42% of London boroughs are seeing declines, the majority (58%) are still recording growth. This paints a clear inner and outer London picture, with the boroughs on the fringes, such as Redbridge, still seeing almost double-digit increases.

So, for some, there may be falls, while others are still experiencing pricing pressures, which are good for sellers, but not so good for first time buyers.

Nevertheless, Faulkner argues that this is a good time for those who are not on the ladder to start looking to see what can be achieved, either on the open market, or via Help to Buy or Shared Ownership.

“Negative media headlines tend to put people off looking, while in actual fact, it can be a good time to bag a bargain – as long as you can hang on to the property for the next five years or more to ride out the uncertain times,” she concludes.

Transactions Plummet in Prime Central London, Especially for New Builds

Published On: May 1, 2018 at 9:12 am

Author:

Categories: Property News

Tags: ,,

Residential property transactions hit another low in prime central London during February 2018 (for which the most recent data is available), while new build sales plummeted, according to the latest Residential Index from investment advisory London Central Portfolio (LCP).


Prime central London

Following a strong January, due to some exceptionally high value property sales, house prices in prime central London fell by 4.6% in February, to hit an average of £2,165,829.

On a quarterly basis, transactions dropped by 2.3%, to 974, while sales were down by 5.7% year-on-year, to sit at 4,176.

The new build sector in prime central London suffered a 13.8% decline over the year, with quarterly transactions down by a whopping 56%, to stand at just 88.

Naomi Heaton, the CEO of LCP, says: “Following a number of high value sales being recorded in January, average monthly prices in prime central London have fallen by 4.6%. This in isolation might be significant. However, it follows five successive monthly rises, attributable to a growing proportion of high value sales as investors take advantage of significant price discounts. The volume of sales has dipped this quarter by 2.3%, although this figure is eclipsed by that of prime central London’s new build sector, which has suffered a 56% drop. Whilst annual transactions, at 4,176, remain at an exceptionally low level, 55% less than in 2007 just prior to the Global Financial Crisis (GFC), there are signs of encouragement. The annual fall is now just 5.7%, compared with a fall of 35.0% in the year running up to the 2017 General Election.

“Potential vendors are clearly still holding out for more favourable market conditions, but, given the low stock levels, it is likely that, when sentiment returns, there will be a bounce back in prices, as seen in 2009/10. Indeed, with sterling hardening, many overseas investors have a clock ticking with regard to picking up prime assets at a discount created by the referendum vote and serial increases in property taxation.”

She continues: “Turning to the controversial new build market, which has been most impacted by a downturn in international buyer sentiment, the sector continues to be volatile, with quarterly and annual price falls. Whilst a lag in registration of new build sales completions means reporting is six months delayed, annual transactions have fallen 13.8%. Quarterly transactions have plummeted to 88, 56% down on the previous quarter. As new build sales completions often represent historic transactions, this situation could worsen over the next two to three years, as new schemes, which may have failed to sell out at asking price due to reduced investor interest, come to completion.”

Greater London 

In the month to February 2018, the average house price in Greater London fell by 1%, taking the typical value to £625,052. Annual house price rises have dropped to an average of 6.5%, with growth in the last quarter standing at just 2%.
Transactions Plummet in Prime Central London, Especially for New Builds

Transactions Plummet in Prime Central London, Especially for New Builds

There has also been a significant drop in quarterly sales, of 10.4% – the largest fall since August 2016.

Quarterly new build prices have declined by 3.5% and represent just 15.6% of all sales in Greater London, compared with a peak of almost 20%. The average new build price is now £641,711.

Heaton comments: “Greater London is continuing to show a slowdown in growth, with a monthly price fall of 1%. Quarterly growth was just 2% compared with the previous year – one of the weakest performances seen in the last two years. Another cause for concern in the sector is the fall in transactions, amounting to 10.4% this quarter. This is the fifth consecutive drop, resulting in an annual fall of 7.3%. Despite Government efforts to stimulate transactions across the UK and in the capital, it appears that homeowners are prepared to sit tight until the current headwinds blow over. First time buyers may well be adopting the same approach, despite the reduction in Stamp Duty, which has done little to alleviate the issue of mortgage caps and the need for large deposits.

“Whilst wages remain relatively static, it is unlikely that we will see any major movement in the domestic market. This is exacerbated by the lack of affordable housing and a credible long-term housebuilding plan.”

She goes on: “This month’s report sees an even more disappointing picture for new build property than the market as a whole, with a drop in quarterly prices of 3.5%. Annual growth in transactions at 5.2% also appears to be slowing, falling from over 25% a year ago. As a result, the proportion of new build sales in the market has fallen to 15.6%, from a high of almost 20%. As new build sales completions often represent historic transactions, properties may be sold off plan several years before completion, making it difficult to read market sentiment. However, after a fairly robust 2017 thus far, we may be seeing a significantly suppressed market.”

England and Wales

Over England and Wales as a whole, LCP reports that house prices were down by 0.4% in the month to February. On a quarterly basis, prices fell by 0.5%, which marks the fourth consecutive decrease. As a result, annual house price growth stands at just 3.4%. The average house price in England and Wales is now £290,624.

Sales declined by 15.4% on a quarterly basis, which is also the fourth consecutive quarterly fall.

New build house prices have seen a 2% decline on a quarterly basis, and a drop in annual sales of 1%. The average new build house price is now £338,694 – 15.8% higher than for existing stock.

Heaton offers her thoughts on the figures: “Quarterly prices dropped by 0.5% in England and Wales, the fourth consecutive fall. Quarterly transactions have also fallen by 15.4%, again the fourth consecutive reduction. This does not paint an encouraging picture for the UK housing market as a whole. It highlights that the Government’s attempts to increase transactions, with Help to Buy schemes and Stamp Duty exemptions, are not proving very effective.

“One would hope the closer we get to Brexit that there will be more certainty in the housing market and the UK’s place in the revamped global landscape. LCP, however, does not see domestic homeowner sentiment changing significantly in the next year, particularly in the face of potential interest rate hikes.”

She concludes: “Despite the generally disappointing picture for England and Wales as a whole, annual prices in the new build sector increased 7.4%. There are, however, worrying signs, with quarterly prices down 2% and annual transactions dipping by 1.0%, the sixth successive month of falls. This may not be surprising, with average prices for new builds now reaching £338,694. At 15.8% higher than existing stock, new units are increasingly out of reach for typical domestic buyers. Overall, only 104,000 new builds were sold in the year to August 2017, still far short of the 300,000 which are projected to be needed each year.”

Index of Private Housing Rental Prices for Great Britain: February 2018

Published On: March 21, 2018 at 10:09 am

Author:

Categories: Lettings News

Tags: ,,,,,

The Index of Private Housing Rental Prices (IPHRP) is an experimental price index tracking the prices paid for renting property from private landlords in Great Britain.

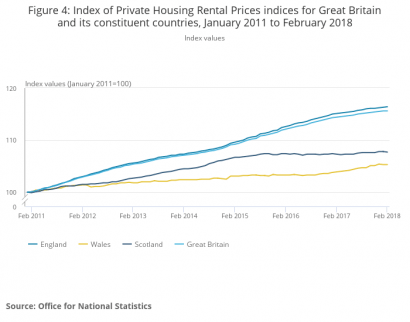
The report shows that private rental prices paid by tenants in Great Britain rose by 1.1% from January to February 2018, the rate of growth here being unchanged in those 12 months.

In England, private rental prices grew by 1.1%, Wales grew slightly more at 1.4%, and Scotland 0.4%.

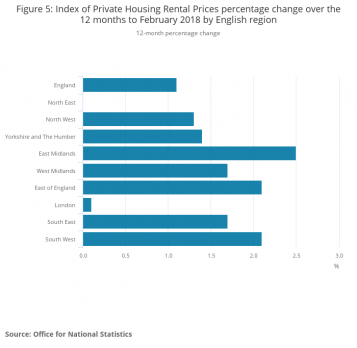
In the capital, London has seen an increase of 0.1%, coming in at 1% below the average for Great Britain as a whole.

The IPHRP covers Great Britain as a series of price indices, and doesn’t measure newly advertised rental prices. Instead, it reflects overall price changes for privately rented properties. Whilst Northern Ireland is not currently included, the Office for National Statistics (ONS) is working to secure private rental data for the entire UK.

The 12 month growth rate of private rental prices paid by tenants in Great Britain has seen signs of a slow down since 2015. It has however  increased by 1.1% in the last 12 months, leading up to February 2018. This has largely been driven by a slowdown in London over the same period; its growth rate (0.1%) is currently at its slowest since 2010, when in September it was at -0.4%.

From January 2011 to February 2018, private rental prices increased by 15.6%. However, London has a great impact on this, and if you exclude the capital, private rental prices increased by 12.6%.

What does this mean for the private rented sector? Kate Davies comments

The Executive Director of Intermediary Mortgage Lenders Association (IMLA), Kate Davies, commented on the ONS’ Index of private housing rental prices (IPHRP) in Great Britain in February:

“These figures reaffirm how subdued private housing rental statistics have been in the last few months. Whilst that may be giving tenants some temporary respite from higher rents, the flip-side is that landlords will be facing downward pressure on their cash-flows and profitability. This comes at a time when successive policy changes in the buy-to-let (BTL) sector have proved detrimental, with net BTL investment falling by 80% since 2015.

“We are already concerned that availability of private rental homes is unlikely to keep up with household numbers. We therefore ask the Government to recognise the benefits that a strong Private Rented Sector (PRS) brings for the UK, and the importance of maintaining a good supply of rental properties for the periods when home ownership is not suitable or achievable for households.”

It seems that all countries in Great Britain have experienced a rise in rental prices, however in England they have increased more than in Scotland and Wales. See below for the index values for Great Britain compared to its constituent countries.

In London, it looks to be the case that growth in private rental prices is continuing to slow. The largest annual rental price increase was found to be in the East Midlands at 2.5% (down from 2.6% in January 2018). This is followed by the South West at 2.1% (unchanged) and the East of England at 2.1% (up from 1.9% in January 2018). The percentage change of private housing rental prices is shown below.