The London Marathon House Price Map for 2017
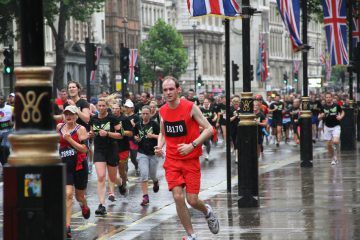
Ahead of this Sunday’s London Marathon, online estate agent eMoov.co.uk has updated its London Marathon Property Price Map for 2017.
The map looks at the difference in average house prices across some of the 26-mile markers in this weekend’s London Marathon.
Across the 16 locations, the average house price is £695,255 – up significantly from last year’s £530,368.
The cheapest option for property buyers this year is at mile four in Woolwich, at an average of £328,866. The most expensive, unsurprisingly, is the final mile market at St James’s Park, with an average house price of £1.6m.
If you’re not too keen on running this Sunday’s race, you can instead take a look through the London Marathon Property Price Map for 2017:

The London Marathon House Price Map for 2017
The race starts in Blackheath, where the average house price is £559,107. It then drops to £450,958 in Charlton, before dropping further to £328,866 in Woolwich. At mile seven, in Greenwich, the average property value rises to £544,899, but falls to £418,949 in Deptford.
It stays just below £500,000 in Rotherhithe and Bermondsey (£496,099 and £497,560 respectively), before soaring to £842,687 in Wapping, at mile 13. However, prices come down to £506,343 in the Isle of Dogs, £526,781 in Canary Wharf, £528,694 in Limehouse and £418,475 in Shadwell.
Towards the end of the route, prices really start to pick up. At Monument, mile 23, average prices are a hefty £949,720. In the City of London, however, they drop to £844,356, before soaring to £1,546,448 in Embankment, at the end of the course.
The Founder and CEO of eMoov, Russell Quirk, says: “The London Marathon is a celebration of London itself and, with the route spanning far and wide across the capital, runners will take in the very best of what the city has to offer. This includes the type of property on the market, and our research shows how the price of London homeownership varies across the route, as well as where aspiring buyers can still find a bargain that offers a good view of Sunday’s race.”

