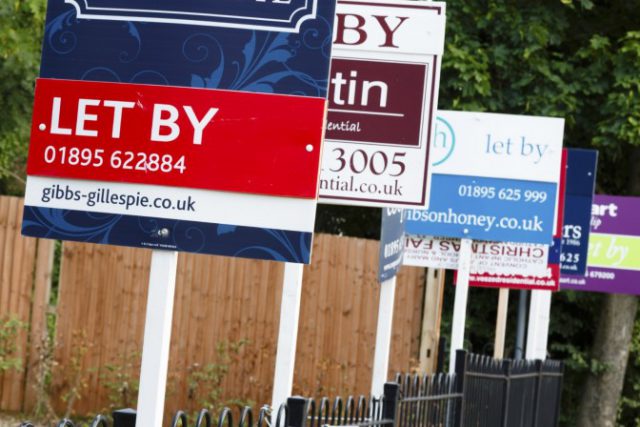
Where are 2017’s buy-to-let hotspots?
A new investigation has revealed the latest UK buy-to-let hotspots, which include Manchester, Leeds, Cardiff and Liverpool.
Of course, the key to buy-to-let investment is to secure a solid rental yield and potential for capital growth through increased house price values.
Hotspots
Data from Aspen Wolf has revealed the latest buy-to-let hotspots to be in these locations. Oliver Ramsden, founder and director of Aspen Wolf, noted: ‘The UK property market stayed strong in 2016 despite a turbulent year, with confidence remaining in the buy-to-let sector in particular.’[1]
‘Rental growth increased but at a slower rate than 2015; this was to be expected however, notably due to the unexpected Brexit result stalling market movement for a short period,’ he continued.[1]
Mr Ramsden went on to say: ‘House prices should start to increase above the 3% mark again in 2017, especially in buy-to-let hotspots which we have identified.’[1]
The top-ten best buy-to-let postcodes were found to be:
| Postcode Area | Area | Average value of property | Number of sales in the last 12 months | Current average asking price | Current average rental price (pcm) | Buy to let yield (%) |
| M | Manchester | £177,686 | 11625 | £202,484 | £1,339 | 7.94 |
| CF | Cardiff | £187,337 | 12356 | £173,850 | £1,054 | 7.28 |
| LS | Leeds | £225,551 | 10339 | £204,072 | £1,217 | 7.16 |
| L | Liverpool | £164,590 | 6859 | £175,641 | £1,027 | 7.02 |
| WS | Walsall | £195,383 | 4995 | £193,944 | £1,106 | 6.84 |
| NE | Newcastle upon Tyne | £184,224 | 12850 | £173,666 | £873 | 6.03 |
| S | Sheffield | £194,673 | 6693 | £180,126 | £888 | 5.92 |
| G | Glasgow | £182,716 | 16454 | £165,046 | £786 | 5.71 |
| B | Birmingham | £189,898 | 10396 | £203,990 | £921 | 5.42 |
| SR | Sunderland | £134,891 | 2282 | £133,028 | £587 | 5.3 |

Where are 2017’s buy-to-let hotspots?
Weak
On the other hand, London’s letting market slowed last year, with rents peaking during April.
Ramsden observed: ‘We forecast this trend to continue, especially within prime central London hence have identified West Central London or the WC postcode, as the top UK location to avoid in 2017.’[1]
The worst locations in terms of rental yields were found to be:
| Postcode Area | Area | Average value of property | Number of sales in the last 12 months | Current average asking price | Current average rental price (pcm) | Buy to let yield (%) |
| WC | Western Central London | £936,660 | Not available | £1,486,208 | £2,877 | 2.32 |
| BR | Bromley | £547,661 | 4121 | £633,812 | £1,287 | 2.44 |
| LD | Llandrindod Wells | £215,894 | 556 | £247,659 | £514 | 2.49 |
| WD | Watford | £563,462 | 3147 | £678,837 | £1,452 | 2.57 |
| SG | Stevenage | £414,561 | 5972 | £476,816 | £1,053 | 2.65 |
| HR | Hereford | £267,871 | 2217 | £306,503 | £692 | 2.71 |
| AL | St Albans | £595,386 | 3271 | £667,922 | £1,521 | 2.73 |
| CB | Cambridge | £416,239 | 5322 | £446,454 | £1,020 | 2.74 |
| EX | Exeter | £290,770 | 9139 | £315,125 | £736 | 2.8 |
| WR | Worcester | £281,073 | 4254 | £288,729 | £674 | 2.8 |
[1] https://www.landlordtoday.co.uk/breaking-news/2017/1/the-best-and-worst-postcodes-for-buy-to-let-returns-unveiled


