Posts with tag: house prices

Annual House Price Growth Eases Again, to 3.3%

Published On: June 7, 2017 at 9:54 am

Author:

Categories: Property News

Tags: ,,,

Annual house price growth eased again in May, to 3.3%, according to the latest House Price Index from Halifax.

The rate of growth recorded last month was lower than in April and is the lowest annual rate seen since May 2013 (2.6%). It is around a third of the 10.0% peak hit in March 2016.

On a quarterly basis, house prices in the three months to May were 0.2% lower than in the preceding quarter. This is the second quarterly decline since November 2012 (0.3%).

Month-on-month, there has virtually been no change in prices, at 0.4%.

Nationally, house prices in May were 11% above their August 2007 peak. The average house price of £220,706 is now £66,043 (43%) higher than its low point of £154,663 in April 2009.
Annual House Price Growth Eases Again, to 3.3%

Annual House Price Growth Eases Again, to 3.3%

The House Price Index also found that sales dropped by 3% between March and April this year, to 99,910. This followed three successive months when sales were above 100,000. Nonetheless, sales in the three months to April were 2% higher than in the previous three months.

The volume of mortgage approvals for house purchases – a leading indicator of completed home sales – fell by 2% between March and April, to 64,600.

Approvals have been in a narrow range between 64,600 and 68,600 per month over the past six months, suggesting that home sales are unlikely to change significantly over the next few months.

Rising inflation and weak wage growth, alongside higher Stamp Duty rates for buy-to-let and second property purchases, have weakened market activity, reports Halifax.

However, supply still remains very low. The number of properties coming onto the market decreased for the 14th consecutive month in April. This kept the average stock level on estate agents’ books close to historic lows.

Nevertheless, a rise in private sector housebuilding has been recorded. Private enterprise new build housing completions rose by 12% in the first quarter (Q1) of this year, compared with the previous quarter. In contrast, completions by housing associations were 5% lower. All completions are 57% above the low seen in Q1 2013, but remain 18% lower than their Q1 2007 peak.

The Housing Economist at Halifax, Martin Ellis, says: “After reaching a recent peak of 10% in March 2016, the annual house price growth has since fallen to 3.3% in May.

“House prices have again fallen over the past three months. Overall, prices in the three months to May were 0.2% lower than in the preceding three months; the same rate as in April.

“The fact that the supply of new homes and existing properties available for sale remains low, combined with historically low mortgage rates and a high employment rate, is likely to support house price levels over the coming months.”

The Founder and CEO of online estate agent eMoov.co.uk, Russell Quirk, also comments: “Despite many predicting a second consecutive monthly drop in house price growth, the latest numbers by Halifax show that prices have, in fact, crept up ever so slightly during May, notwithstanding a marginal fall in the last quarter.

“The unpredictability of recent house price trends demonstrates the turbulent landscape that both the UK property market, along with the wider economy, have had to traverse over the last year or so. With the snap election looming imminently, the recent cool in price growth seems to be thawing and it is no coincidence that one of the overarching factors in the recent price growth slowdown has been a shortage of stock, more so than usual.”

He adds: “Tomorrow’s vote will be pivotal in shaping the future of the UK housing market. However, regardless of which way it goes, it is likely that the sector will receive a boost from the many home sellers and buyers who, until now, will have been putting their decision on hold until the election dust has settled.”

eMoov has recently accessed which political party has been best for the property market since 1970: /best-political-party-house-price-growth/
Trade Union Backs Labour in Election as House Price to Earnings Ratio Hits 8.2

Published On: June 6, 2017 at 9:13 am

Author:

Categories: Property News

Tags: ,,,,

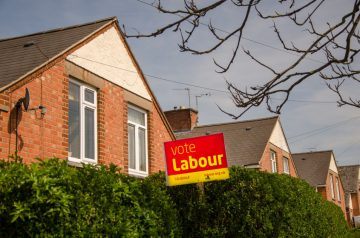
Trade union GMB has backed Labour in Thursday’s (8th June) General Election, following its pledges to build more council homes, after research showed that average house prices in England have hit 8.2 times typical earnings.

Trade Union Backs Labour in Election as House Price to Earnings Ratio Hits 8.2

Trade Union Backs Labour in Election as House Price to Earnings Ratio Hits 8.2

The analysis by the London division of the GMB, based on Land Registry house price figures and Office for National Statistics (ONS) earnings data, showed that in the East of England, the average house price in March 2017 was £277,127, which is a huge 9.2 times the average full-time earnings for the area, of £30,000.

The situation was worst in Three Rivers, where average house prices are 15.9 times typical wages, followed by 15.1 in Hertsmere, 13.6 in Cambridge, 13.4 in St Albans and 12.9 in Epping Forest.

Across England as a whole, house prices were 8.2 times average earnings.

Warren Kenny, the London region secretary of GMB, insists that these statistics show that voters should back Labour in the General Election, due to its pledges to build one-million homes in the next parliament – half of which would be council houses.

Kenny explains: “GMB London region analysis of average house prices to average earnings in the East of England shows that the aspirations of working people on average earnings and below to own their own homes is no longer achievable.

“The Labour Party election manifesto pledges to build one-million homes in the next parliament, with half of them council housing. These figures show that more council homes for rent in all council areas are absolutely essential.”

He urges: “GMB is calling on the electorate in the East of England to get behind their Labour Party candidates in the area to realise this manifesto commitment.

“We have been talking about this problem for far too long. There can be no excuses for not providing housing to people that they can afford to live in on average wages.”

If you’re still contemplating who to vote for, this analysis by eMoov shows which political party has been best for house price growth since 1970: /best-political-party-house-price-growth/

Which has been the Best Political Party for House Price Growth Since 1970?

Published On: June 6, 2017 at 8:12 am

Author:

Categories: Property News

Tags: ,,,,

Ahead of Thursday’s (8th June) General Election, online estate agent eMoov.co.uk has taken a look at which political party has been the best for house price growth since 1970.

The agent analysed historic house price data to determine which majority government – Labour or Conservative – has had the greatest impact on house price growth per year during their reigns across all 650 parliamentary constituencies.

When the Conservative government first took power in June 1970, the average UK house price was just £4,508. Almost half a century later, and today’s Conservative Government oversees a very different economic landscape. In the past 47 years, house prices have surged by 4,724.80% to the current average of £217,502.

But despite the Conservatives currently overseeing a housing crisis – caused by their inability to build the homes needed to meet buyer demand – historically they aren’t the best party for UK homeowners who want to see the values of their properties climbing. This, in fact, is the Labour Party, which has seen house price growth of 16.62% per year of its reign, to the Conservative’s 15.14%.

House price growth since 1970 

Conservatives: 1970-1974 

Which has been the Best Political Party for House Price Growth Since 1970?

Which has been the Best Political Party for House Price Growth Since 1970?

During the Conservative’s initial majority government, led by Edward Heath, house prices rose by 120.23% – 30.06% for each of the four years, which is the largest rate of growth per year to date.

Labour: 1974-1979 

Labour then governed over a slightly lower rate of price growth across a similar timeframe, split between Harold Wilson and James Callaghan, with prices up by 92.14% between 1974-1979 – an increase of 18.43% per year.

Conservatives: 1979-1997 

A Conservative government then followed for 18 consecutive years, first led by Margaret Thatcher, who saw house prices rise by 187.91% between 1979-1990, before John Major ruled the next seven years, pushing the total price increase under the Conservatives to 206.18% – the highest total growth since 1970, but an average of just 11.45% a year.

Labour: 1997-2010

Under the 21-year reign of Tony Blair and Gordon Brown’s Labour governments, the total increase in house prices hit 192.53% – a rise of 14.81% per annum.

Conservatives: 2010-now

In the past seven years, under a Conservative majority government, house prices have increased by just 27.31%, as the market has slowed from the extreme rates recorded over the last three decades. This equates to an average increase of just 3.90% per year.

Highest and lowest growth under Labour 

The constituencies to have seen the slowest rate of house price growth under Labour since 1970 are Airdrie and Shotts, Coatbridge, Chryston and Bellshill, and Motherwell and Wishaw. All three are located north of the border in Scotland and all have seen price growth of just 13.56% under Labour governments.

The highest growth was seen in North Down in Northern Ireland, at 24.59%, with the top ten highest constituencies under a Labour government all located in Northern Ireland.

Highest and lowest growth under the Conservatives

The constituency to have recorded the lowest house price growth per year under a Conservative government is Pendle in the North West – up by just 8.39%.

Since 1970, the top ten lowest constituencies for annual house price growth under a Conservative majority government are all located in the North East or North West.

Somewhat expectedly, the constituency to have seen the greatest annual rate of house price growth under a Conservative government is Kensington, at 33.87%. In fact, the top 125 constituencies to have recorded the highest rates of house price growth are all located in London, the South East or East of England.

The Founder and CEO of eMoov, Russell Quirk, comments on the findings: “This research really isn’t trying to highlight that one party is better than the other, but more which party is better for the UK populace, depending on their current residential situation.

“All the major parties have attempted to address housing in the run-up to this month’s election, but have outlined very little other than the usual empty promises on building and which, let’s face it, has historically ensured a rapidly rising rate of house price growth in itself. One wonders whether successive governments have purposely sought to strangle housing supply to encourage value growth and therefore a tail wind of voter enthusiasm for their particular political colour at successive elections?

“Therefore, we thought it important that both buyer and seller alike have something else to base their decision to vote on, that was at least based on fact, albeit historical evidence.”

He continues: “If you are in the privileged decision of owning a home in the UK, Labour is the party to ensure your bricks and mortar assets continue to appreciate. If you are a struggling aspirational buyer, then on the face of it the Conservatives are marginally better where a lower rate of price growth is concerned and to better enable you a foothold on the property ladder.

“Of course, the UK picture will vary drastically when considering individual constituencies, so we would suggest looking at the wider data set to see how the two differ in house price performance for your local area.”

Property price growth slows for third straight month

Published On: June 1, 2017 at 11:54 am

Author:

Categories: Property News

Tags: ,,,

The latest research from Nationwide has shown that UK property prices have fallen for the third consecutive month – the first time this has happened since 2009.

May’s data indicates that yearly house price growth slid to 2.1% – the weakest in nearly four years.

Election Uncertainty

Nationwide looked at house price movements in the months around previous elections and the EU referendum last year. Its analysis found that previous elections do not seem to have generated much volatility in property prices, or significant changes in trends.

Robert Gardner, Nationwide’s Chief Economist, noted: ‘If history is any guide, the slowdown is unlikely to be linked to election-related uncertainty. Housing market trends have not traditionally been impacted around the time of general elections. Rightly or wrongly, for most home buyers, elections are not foremost in their minds while buying or selling their home.’[1]

‘On the whole, prevailing trends have been maintained just before, during and after UK general elections. Broader economic trends appear to dominate any immediate election-related impacts. It is too early to conclude whether the slowdown in house price growth is merely a blip, a reflection of the impact of the squeeze on household budgets, or is due to mounting affordability pressures in key areas of the country,’ he continued.[1]

Moving on, Gardner said: ‘Given the ongoing uncertainties around the UK’s future trading arrangements and the upcoming election, the economic outlook is unusually uncertain, and housing market trends will depend crucially on developments in the wider economy.’

‘Nevertheless, in our view, household spending is likely to slow in the quarters ahead, along with the wider economy, as rising inflation increases the squeeze on household budgets. This, together with mounting housing affordability pressures, is likely to exert a drag on activity and house price growth in the quarters ahead.’[1]

Property price growth slows for third straight month

Property price growth slows for third straight month

Momentum Loss

Russell Quirk, founder and CEO of eMoov.co.uk, observed: ‘A third consecutive drop may seem like a reason to worry for UK homeowners, but house prices still continue to climb despite the slowdown in the rate of growth.’

‘It is unclear as to whether the market is losing momentum or if buyer demand is unseasonably hibernating due to the oncoming election, but Nationwide have been quick to highlight that previous elections have had little impact on traditional house price trends.
It’s fair to say, however, that previous years were a tad more routine that a snap election called in the middle of negotiations to leave the EU and it is likely that the market is seeing an influence from both sides.’

‘House prices, along with the gap when compared to earnings, have continued to increase and such a pattern is unsustainable in the long term. It is likely that we will see the market let off a little steam and naturally adjust over the coming months and overall it should stabilise once the election dust has settled and buyer confidence returns to full force.’[1]

[1] http://www.propertyreporter.co.uk/property/house-prices-fall-for-third-month-in-a-row.html


Flats see largest increase in pricing since 2009

Published On: May 22, 2017 at 11:33 am

Author:

Categories: Property News

Tags: ,,,,,

The most recent research from the Halifax has shown how different property types have increased in price during the last seven years.

Data from the report indicates that flats have seen the most prominent rise- increasing in value by 53% during the last seven years. This was in comparison to 39% for all property types.

Increases

Flats have typically increased in value by £1,008 per month, from the £159,292 recorded in the final quarter of 2009, to £243,936 in the last three months of 2016.

Terraced homes saw the next biggest rise over the period, increasing in value by 43% over the seven years. On the other hand, detached homes saw the smallest increase, of 19%.

Much of the rise in the price of flats since 2009 can be attributed to the major increase in flat prices in London, where values have risen by 65%. In addition, flats make up 48% of all sales of property in the capital, in comparison to the UK average of just 11%.

The average price of a flat in London currently stands at £398,038, with the price in the rest of the UK much lower at £167, 144. In fact, should London be excluded from the data, terraced homes saw the greatest increase over the period (41%), followed by flats (35%).

Regional Rises

By region, flats have been the best performing property type since 2009 in five of the eleven regions assessed. These were:

  • North- 31%
  • North West – 37%
  • South West – 33%
  • Yorkshire and the Humber – 30%
  • Scotland – 21%

Terraced houses rose quickest in:

  • London – 73%
  • East Anglia – 46%
  • East Midlands – 35%

Six in ten property transactions are for terraced or semi-detached properties. This said, semi-detached homes have risen in popularity with first-time buyers, making up 30% of purchases in 2016 – a rise from 28% in 2009.

Flats see largest increase in pricing since 2009

Flats see largest increase in pricing since 2009

Affordability

Averaging at £215,690, terraced properties are the most affordable property type in the UK. This was followed by semi-detached homes (£225,070) and flats (£243,936).

Outside of London, flats are most affordable (£167,144) followed by terraced housing (£185,116).

Martin Ellis, Halifax housing economist, said: ‘Nationally, terraced and semi-detached homes are the most affordable and popular homes with buyers accounting for 60% of sales during 2016. However average price growth for flats, helped by the London market, have outperformed all other property types since 2009.’[1]

‘There has been an increasing trend for first time buyers to choose semi-detached homes over the past seven years, whilst terraced homes have shown a decline in popularity. The rise in the age of a typical first time buyer may partly account for this change in preference towards the family-friendly semi,’ he added.[1]

[1] http://www.propertyreporter.co.uk/property/flat-prices-up-over-50-since-2009.html


Average UK House Price 6.05 Times Typical Earnings

Published On: May 12, 2017 at 8:15 am

Author:

Categories: Property News

Tags: ,,,,,

The average UK house price is currently 6.05 times the typical earnings in the country, according to the latest research by leading hybrid estate agent eMoov.co.uk.

The agent also found that there is an average gap of £6,111 between the current typical wage and the wage required for a general mortgage approval of 4.5 times the borrower’s salary.

eMoov compared the latest Land Registry house price figures with the recently updated Office for National Statistics wage data, to highlight where across the UK presents the greatest obstacle for aspiring homebuyers, both in terms of the wage to house price ratio, and the reality gap between the average wage available and the wage required to secure a mortgage in each area.

The average property price was divided by the typical earnings to find the wage to house price ratio for each area. eMoov then calculated the mortgage deficit by deducting a 10% deposit from the average house price, before dividing it by 4.5 – the standard multiple of a salary required for mortgage approval. The agent then worked out the difference between the average salary in each area and the salary required to purchase a property at the average house price for that location.

The full data is available here.

The worst locations by average wage to average property price

With London house prices continuing to spiral out of control it is no surprise that – with the exception of Purbeck in Dorset – the areas for the worst house price to earnings ratios are in the capital. It is by far the worst region in the UK, with the average house price standing at 12.05 times the typical wage.

Hackney is the worst borough, with the average house price of £575,511 a huge 17.03 times the average wage of £33,800. Brent (16.37) and Haringey (16.21) are also home to an average property price over 16 times the typical wage in the area.

Average UK House Price 6.05 Times Typical Earnings

Average UK House Price 6.05 Times Typical Earnings

Waltham Forest (15.69), Ealing (14.77), Harrow (14.73) and Barnet (14.18) are amongst the other worst offenders, while Purbeck is the only non-London entry in the top ten, at 14.12.

Hammersmith & Fulham (14.06) and Newham (13.18) complete the top ten worst locations.

Outside of London, the gap closes slightly, although all of the areas in the top ten are home to house prices of more than 12 times the average earnings.

After Purbeck, the worst area is Oxford, where the average house price of £408,488 is 13.18 times the typical salary of £31,000. South Bucks (13.08), Hertsmere (12.95), Three Rivers (12.81), South Hames (12.65), Broxbourne (12.53), Christchurch (12.47), Epsom and Ewell (12.44), and Brighton and Hove (12.43) complete the top ten worst areas outside the capital.

The worst locations by gap in earnings for mortgage requirements 

As with the wage to house price ratios, the top ten worst locations where the gap in earnings for mortgage requirements is concerned are all in London, with the exception of one.

Despite having some of the largest wages on offer in the capital, the high price of property in Kensington and Chelsea, Westminster and Camden means that the gap between the average wage on offer and the wage needed to secure a mortgage is over £100,000 – £162,086, £131,126 and £106,138 respectively.

Hammersmith & Fulham (£99,476) and Hackney (£81,302) are also home to some of the largest deficits in London, while South Bucks is the only entry in the top ten outside of the capital, with a gap of £79,314 between the average salary and the salary needed for a typical mortgage approval.

Haringey (£77,813), Richmond (£74,924), Islington (£74,530) and Wandsworth (£71,190) complete the top ten.

The best locations by average wage to average property price

At the other end of the spectrum, the ten best areas are home to an average house price under five times the typical wage – although they are, for the large part, located in the north, Wales and Scotland, so not much hope for southern homebuyers.

With the average house price of £80,605 just 3.43 times the average wage (£23,500), Burnley is home to the smallest gap between the cost of buying a home and the available earnings on offer.

East Ayrshire (3.66), Inverclyde (3.67), Blaenau Gwent (3.74), West Dunbartonshire (3.76), North Ayrshire (3.85), Copeland (3.86), North Lanarkshire (3.91), Rhondda Cynon Taf (4.03) and County Durham (4.04) complete the top ten.

The best locations by gap in earnings for mortgage requirements

Burnley again takes the top spot where financial requirements for a mortgage are concerned. The average wage of £23,500 is £7,379 more than the 4.5 times requirement (£16,121) on the average house price of £80,605.

All of the top ten locations exceed the financial mortgage requirements by more than £4,000, but, again, are for the largest part in the north and Scotland.

They are: Copeland (£7,055), Inverclyde (£7,016), East Ayrshire (£6,262), West Dunbartonshire (£6,265), North Ayrshire (£5,819), Blaenau Gwent (£5,305), County Durham (£4,731) and Hartlepool (£4,700).

By region 

As mentioned, London is by far the worst region, with the South West (9.55) surprisingly the second worst. The South East (9.50) and the East of England (9.33) are more predictably the next largest ratios. The North East is the best, despite its lower wage, with the average house price of £123,749 just 4.95 times the typical earnings.

London is also home to the largest gap between average wage and the wage needed for mortgage approval, at £55,541, while the North East is the only region with a positive difference, of £250.

The Founder and CEO of eMoov, Russell Quirk, comments on the data: “When London is thrown into the spotlight in terms of the unaffordability of its property market, many are quick to highlight that the wages on offer are higher in the capital. However, this research shows that, despite this, the gap between what hopeful London buyers are earning and what they are having to pay for a property is still way out of kilter and climbing. Not only this, but the reality gap between the average wage and wage required for mortgage approval is staggering. Of course, many of us buy with a partner or friend in order to get on the ladder, but even when sharing this burden, there is still a considerable financial mountain to climb.

“It also shows that, elsewhere around the nation, there is almost a direct correlation between what a property goes for and the earnings on offer. But regardless of where you live and what you earn, there has been a serious unbalance between the escalating price of property and the stagnating wages available to UK buyers. This really needs to be addressed to help current and future UK buyers get a foot on the ladder and continue climbing it.”