Posts with tag: house prices

Aspiring Property Developers say Economic Growth will have the Greatest Effect on House Prices

Published On: May 14, 2018 at 10:01 am

Author:

Categories: Property News

Tags: ,

LendInvest has published the results of its survey of property developers, revealing what they think will affect house price growth in the next five years.

When asked what they thought will have the biggest effect on house prices, those surveyed thought national economic growth is likely to have the biggest impact.

Only a quarter (24%) believed that political developments, such as further elections and Brexit, will affect house price growth the most.

 A fifth (20%) of those who took part in the survey thought shortage in supply of housing to be the biggest concern affecting house prices, while 16% of aspiring developers cited the construction of new infrastructure such as the new HS2 and Crossrail lines as the key influencing factor.

 Steve Larkin, Director of Development at LendInvest, commented: “It is great to see that the next generation of SME housebuilders are so confident about prospects for the housing market in the medium term. Typically, we might expect to see more scepticism or concern surrounding the impact of Brexit on the market. Likewise, shortage of supply is the conventional culprit for pushing house prices up.

“Naturally we must wait to see how the economic and political developments of the next year or two unfold. But for now, it’s encouraging to see these aspiring developers taking such a fresh perspective on the market they’re entering.”

"Demand for housing is often noted to be ‘income elastic’ – with rising incomes leading to more being spent on houses."

“Demand for housing is often noted to be ‘income elastic’ – with rising incomes leading to more being spent on houses.”

How does economic growth affect house prices?

Demand for housing is dependent on income. With higher economic growth and rising incomes, people will be able to spend more on houses, which increases demand and pushes up prices. In fact, demand for housing is often noted to be ‘income elastic’ – with rising incomes leading to a bigger proportion of incomes being spent on houses.

In a recession for example, falling or loss of incomes will mean people can’t afford to buy. In addition, those who lose their job may find they can’t keep up with mortgage payments and end up having their home repossessed. Unemployment is also linked to economic growth; fewer people will be able to afford a house with higher employment rates, and even the fear of an unstable jobs market will put people off buying a house.

With house prices still out of reach for millions of people, Dan Wilson Craw, director of Generation Rent, says: “Rising house prices over the past 25 years have put home ownership out of reach for millions of people. But this trend has created a feedback loop that encourages investors to speculate on property. This diverts capital from productive parts of the economy, and lifts prices even further away from what the average household can afford.

“Dispelling expectations that prices will keep rising will also help ensure that the landlords who are renting to the rest of us are doing it to provide long-term homes rather than gambling on capital gains and booting out tenants when they want to cash in.”

London House Price Averages are Distorting Reality, Expert Warns

Published On: May 10, 2018 at 9:48 am

Author:

Categories: Property News

Tags: ,

The average house prices that are reported for Greater London in various industry indices are distorting what is actually happening on the ground, according to property expert Kate Faulkner.

“The figures for London this quarter are kind of astonishing,” Faulkner begins. She explains that, since 2000, the capital has been used to recording house price growth of 7-8% every year.

Since 2009, when most parts of the UK saw house prices at their lowest due to the recession, growth for some has been 100% over just ten years, meaning double-digit annual increases for many.

“Yet now, the property price picture couldn’t be more different,” Faulkner claims.

She notes that all indices have recorded year-on-year house price declines in London, albeit by small amounts when compared to recent growth, although the price falls appear to be hitting apartments more than the short supply of houses, with detached house prices still growing at just over 3% per year, matching inflation.

Faulkner acknowledges that this will be good news for many, as buyers can have some “rare respite” and take their time to purchase a property, as well as make “a cheeky offer”, while any homeowner who purchased before 2016 will still have seen “phenomenal growth in prices”, even if they bought at the height of the market in 2007/08.

“The current losers will be those who have bought over the last few years at the current height of the market and may now have seen their property values fall,” Faulkner adds. “This, though, is only an issue for a fraction of people who are forced to sell for whatever reason.”

It’s the distortion that Greater London house prices averages are having on the market that is most concerning to Faulkner.

She explains: “For those areas which have seen huge growth over the last ten years, such as the likes of Hammersmith & Fulham, as well as Tower Hamlets, prices are seeing falls of over 5%. Although this doesn’t seem like a big deal for most, with average house prices of £500,000+, this gives the media their scary headlines of Londoners having £25,000 or more wiped off the value of their home. However, it’s all relative, and for those who bought a few years ago, this will be nothing compared to the gains they have made since the credit crunch hit.”

Faulkner points to Hometrack’s latest index, which shows that, although 42% of London boroughs are seeing declines, the majority (58%) are still recording growth. This paints a clear inner and outer London picture, with the boroughs on the fringes, such as Redbridge, still seeing almost double-digit increases.

So, for some, there may be falls, while others are still experiencing pricing pressures, which are good for sellers, but not so good for first time buyers.

Nevertheless, Faulkner argues that this is a good time for those who are not on the ladder to start looking to see what can be achieved, either on the open market, or via Help to Buy or Shared Ownership.

“Negative media headlines tend to put people off looking, while in actual fact, it can be a good time to bag a bargain – as long as you can hang on to the property for the next five years or more to ride out the uncertain times,” she concludes.

The UK’s Top 10 Spookiest House Price Drops of the Year

Published On: October 31, 2017 at 9:01 am

Author:

Categories: Property News

Tags: ,,

It has been a particularly spooky year for some UK property owners, with Brexit and a snap General Election bringing an uncertain market. Some property owners have seen the price of their homes drop in line with a lack of buyer demand.

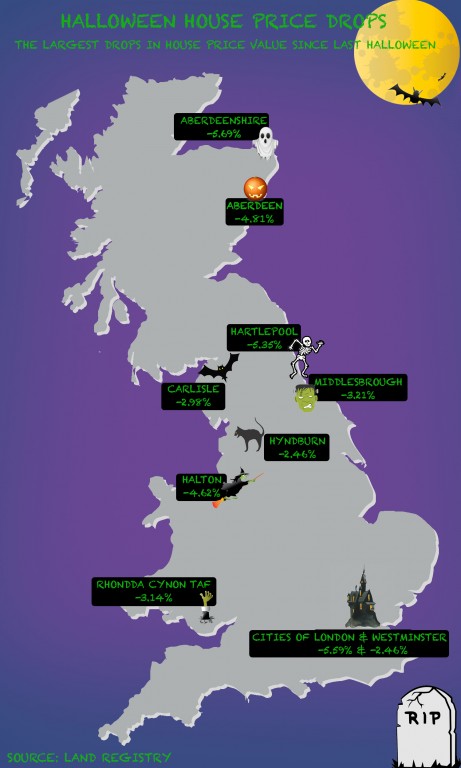
In light of Halloween and all the ghastly things that come along with it, hybrid estate agent eMoov.co.uk has compiled a list of the top ten areas of the UK that have suffered the scariest house price drops of the past year…

The UK's Top 10 Spookiest House Price Drops of the Year

The UK’s Top 10 Spookiest House Price Drops of the Year

  1. Aberdeenshire: -5.69% 

Topping the list is Scotland’s Aberdeenshire, which suffered the frightening price drop of 5.69%. Although property values in Scotland remain lower than the UK’s average, this part of northern Scotland has been hit hardest over the last year, with a typical house price of £188,876 – largely dye to the continued economic slump from a decline in the oil industry.

  1. City of London: -5.59%

Prices in the capital have taken a spine-chilling turn over the last 12 months – not because of ghosts or zombies – but instead because of the inflated price of property. The City of London has endured a decrease of 5.59%, although prices still average £800,802.

  1. Hartlepool: -5.35%

Durham’s Hartlepool follows closely behind, with a drop of 5.35%, taking the average property value to £100,957.

  1. City of Aberdeen: -4.81%

Keeping up with the wider area, the largest city in the region has seen a spooky dip in house prices, down by 4.81% over the year to an average of £167,903.

  1. Halton: -4.62%

Heading back to England, Cheshire’s Halton has suffered a haunting fall in average values of 4.62%, taking prices to £127,003.

  1. Middlesbrough: -3.21%

North Yorkshire’s Middlesbrough experienced a decline of 3.21% in average house prices over the year, bringing the typical value down to £108,904.

  1. Rhondda Cynon Taf: -3.14%

Wales’ darkest price decline was 3.14% in the south, dropping the average house price to an almost supernatural £101,675.

  1. Carlisle: -2.98%

In Cumbria, the average property value in Carlisle has trickled down by 2.98%, leaving it at £129,425.

9 & 10. City of Westminster & Hyndburn: -2.46%

Another contender in the capital, prime central London’s City of Westminster experienced a grim drop of 2.46% to a devilish average of £962,510. Lancashire’s Hyndburn accompanies it, where property values also fell by a gruesome 2.46% to an average of £93,628.

Russell Quirk, the Founder and CEO of eMoov, comments: “Although the current state of the UK market may appear scary, the haunting uncertainty that came with the snap election and the referendum has begun to slowly vanish, so we should start to see positive price growth creep across the majority of the UK before next Halloween.”

Property Sales Supporting House Price Growth in UK Cities

Published On: October 26, 2017 at 8:01 am

Author:

Categories: Property News

Tags: ,,

House price growth in UK cities is currently running at an average of 4.9%, supported by high levels of property sales, according to the latest UK Cities House Price Index from Hometrack.

The annual rate of house price growth across the 20 cities included in the index was 4.9% in September – down from 6% in the same month last year. The quarterly rate of growth, however, is at the highest level for 14 months, supported by a nationwide increase in housing sales over the last quarter compared to the previous 12 months.

This unseasonal rise in sales is likely a result of households delaying purchases earlier in the year at the time of the snap General Election.

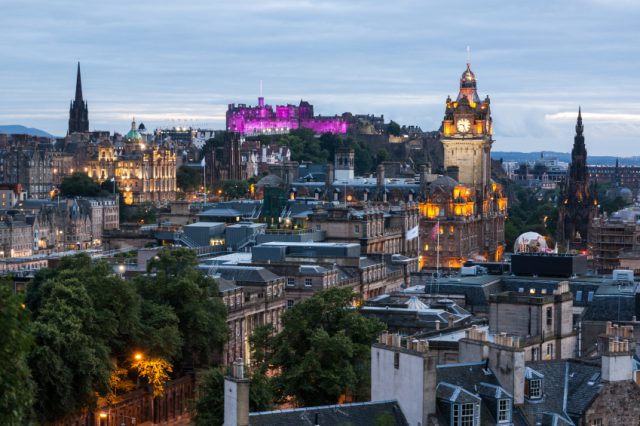
In September’s index, annual house price growth ranges from -1.8% in Aberdeen to +6.7% in Edinburgh. This is the smallest variation in growth since July 2015 and is a result of a marked slowdown in price inflation across all cities in southern England.

There are five cities where the current level of nominal house price growth is below the rate of consumer price inflation – Aberdeen, Cambridge, Oxford, London and Cardiff.

Scottish cities outperforming the rest

While most cities are registering house price growth below that of a year ago, there are six cities where the annual rate of inflation is higher, most notably in Scotland. Residential transactions data from HM Revenue & Customs (HMRC) shows that there has been a 20% increase in the monthly run rate of sales over the past quarter in Scotland.

Increased activity has supported an acceleration in the rate of house price growth in the country. Edinburgh is the fastest growing city covered in the index (6.7%), overtaking Manchester (6.5%) and Birmingham (5.9%), where the rate of inflation has moderated slightly.

Glasgow has also recorded a marked rise in the rate of house price growth, from 1.8% a year ago to 5.3% today. While Aberdeen has registered a 15% decline in average prices since 2015, the rate of annual growth has slowed to -1.8% – the lowest level for exactly two years.

London house price growth at 2.3% 
Property Sales Supporting House Price Growth in UK Cities

Property Sales Supporting House Price Growth in UK Cities

The annual rate of house price inflation in the capital has stabilised at an average of 2.3%. This is well down, however, on the 8% rate of growth seen since 2010.

Across the markets covered by London, house price growth ranges from +4% in Epping Forest and Gravesham, to -5% in the City of London. There are six markets where house prices are falling in nominal terms, primarily in inner London.

Real term price falls in London

However, low nominal rates of house price growth mean that average property values are currently falling in real terms across 85% of markets in London. Further price declines in real terms are inevitable, as prices re-align to what buyers are willing to pay.

Concerns over Brexit and its impact on jobs and employment are weighing on market sentiment, while low gross yields and a weak outlook for house price growth are impacting the case for property investors. Hometrack expects nominal house price inflation in the capital to remain in the 1-3% range for the next six to 12 months, as volumes contract further.

Moderation in headline growth rate

The firm expects house prices to continue to rise in regional cities, where values are still growing off a low base and affordability remains attractive. The rate of growth is likely to moderate around its current level, tempered by economic and sentiment factors, such as the squeeze on incomes from rising inflation and concern over the economic outlook.

Talk of a potential increase in interest rates, with a knock-on for mortgage rates, is likely to further temper demand.

Impact of interest rate rise

A modest increase in mortgage rates will initially impact sentiment and levels of market activity, Hometrack believes. Mortgage rates remain low by historic standards and, for the last three years, all homeowners buying with a mortgage have had to prove that they can afford a much higher mortgage rate, of around 7%. Recent sales levels already reflect the ability of buyers to afford higher borrowing costs.

Households are already responding to low mortgage rates, with almost 90% of new mortgages written in the second quarter (Q2) of 2017 taken at fixed rates. Three-fifths of outstanding mortgage balances are also at fixed rates, providing some insulation to any increase in interest rates in the near term.

Investor buying power 

Higher borrowing costs would also affect demand from investors, who account for around 20% of all housing sales per year. In the face of an increase in borrowing costs, rational investors should either seek property with higher yields, or look to pay less for properties to generate a higher yield.

This means bidding less for housing than they would have if rates stayed low. This would compound the impact of recent tax changes and further moderate investor demand, and, with it, the rate of house price growth in markets where landlords have been most prevalent.

The Founder and CEO of online estate agent eMoov.co.uk, Russell Quirk, comments on the report: “As the final stretch of 2017 comes into view, a late flurry of city-based property transactions has seen a degree of stability return to the market. Due to the generally higher price tag of city living, it is these areas that have been impacted by recent market uncertainty the most and, although growth is still down year-on-year, it will be a promising sign for these homeowners.

“Unfortunately for London, it continues to be last year’s must-have, waning in popularity amongst buyers due to the high price of the capital’s property, while the hottest trend for 2017 is currently tartan, as Edinburgh shows extremely strong growth to overtake Manchester for the top spot.”

He continues: “That said, poor Aberdeen remains the toffee penny in a seasonal box of Quality Streets. Once such a firm favourite, it is now consistently last where demand is concerned, left in the box long into the New Year, chosen by just a few who remember the glory days. Much as tastes for sweets today have shifted, it is unlikely Aberdeen will find any newfound popularity amongst buyers, and it continues to suffer from the decline in the oil industry.

“Despite the overall renewed level of confidence, the market should continue to tread cautiously at least until the year is out. However, growth will remain subdued but consistent across the more affordable options, such as Manchester, Birmingham, Leicester and so on.”

Quirk concludes: “London, along with the other over-inflated cities, such as Oxford and Cambridge, will no doubt continue to struggle due to their much higher price tags, and these areas will be the last to see any meaningful return of buyer demand.”

Scotland Leading House Price Growth Across the UK

Published On: October 20, 2017 at 8:05 am

Author:

Categories: Property News

Tags: ,,

The Scottish property market continues to defy the slowdown elsewhere in the UK, with Scotland now leading house price growth across Britain, reports Your Move.

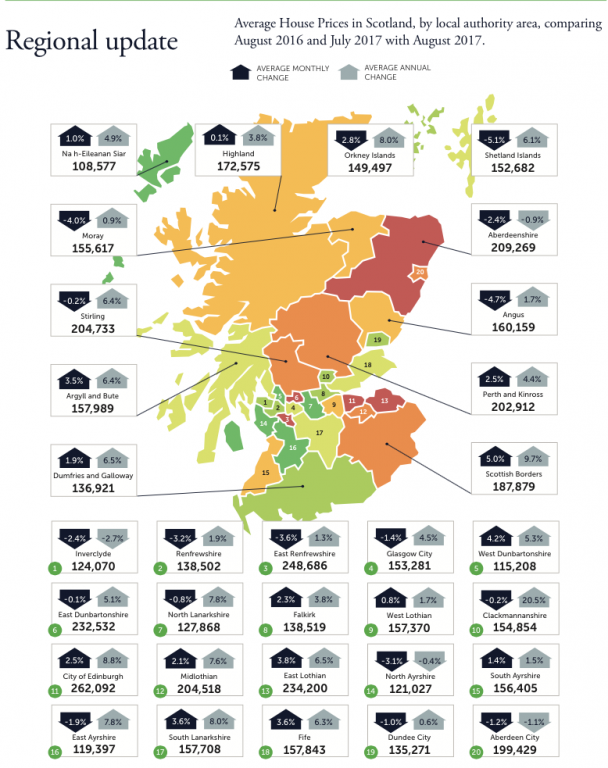
The average house price grew for the seventh consecutive month in August, by 0.5%. On an annual basis, house prices have risen by 4.8% since August 2016, compared to a rate of 2.1% in England and Wales.

Only the East of England (4.5%) comes close to the annual growth seen north of the border, while the average house price in London is down by 0.7% on last year.

These changes leave the average property value in Scotland at £176,876 – up from £168,726 in the same month last year.

Scotland Leading House Price Growth Across the UK

Scotland Leading House Price Growth Across the UK

On a monthly basis, Scotland’s local authority areas continue to experience mixed fortunes. Exactly half of the 32 locations in Scotland saw prices rise in August, headed by the Scottish Borders, where the average value was up by 5%, to reach £187,879. West Dunbartonshire, where the average house price is just £115,208, was next, up by 4.2%.

At the other end of the scale, prices in Angus dropped by an average of 4.7%. The Shetland Islands saw a greater decline, of 5.1%, but low transaction volumes there often mean big swings in monthly prices.

Year-on-year, however, there’s much more consistency, with just four areas seeing prices drop. The greatest fall (of 2.7%) was recorded in Inverclyde, following a strong 2016 as a result of sales of new build detached houses.

By contrast, there’s been good growth for a number of areas. Prices rose by 8.8% in the City of Edinburgh – the most expensive location to purchase a property in Scotland, at an average value of £262,092 – while the Scottish Borders saw an average increase of 9.7%. Prices were up by 8% in the Orkney Islands and South Lanarkshire, while Clackmannanshire saw growth of 20.5% – although this again reflects that the area has few sales.

A number of other spots also saw significantly higher than average rises, including North Lanarkshire and East Ayrshire (both up by 7.8%), and Midlothian (up by 7.6%).

Your Move reports that low interest rates and unemployment at a 42-year low are supporting a market that doesn’t suffer from the same affordability problems as London and the South East, which both lower the average in England and Wales.

To date, Scotland has also avoided a slowdown in property sales. May, for which the latest Office for National Statistics (ONS) figures are available, saw 8,241 homes sold in Scotland. That means that, for the first five months of the year, sales were 2% higher than in the same period of 2016 and up by 6% on 2015.

The Managing Director of Your Move Scotland, Christine Campbell, says: “Housing
 in Scotland continues to shake off the uncertainty we’re seeing elsewhere in the UK economy. Here, low interest rates, high employment and prices that are still affordable are supporting continued robust growth.”

Alan Penman, a Business Development Manager for Walker Fraser Steele, one of Scotland’s oldest firms of chartered surveyors, adds: “Scotland’s housing market is now leading Britain, and that simply reflects very strong fundamentals. It’s always dangerous to speak too soon, but the market currently looks in good shape.”

It may be wise to consider a property purchase north of the border for strong capital growth!

House Prices in 28 Locations Fail to Recover to Pre-Crisis Levels

Published On: October 19, 2017 at 8:04 am

Author:

Categories: Property News

Tags: ,,,

House prices in 28 towns and cities across the UK have failed to recover to pre-financial crisis levels, a decade after the market crash.

Property owners in these locations have suffered a lost decade of house price growth since the start of the crisis on 9th August 2007.

House Prices in 28 Locations Fail to Recover to Pre-Crisis Levels

House Prices in 28 Locations Fail to Recover to Pre-Crisis Levels

The latest Office for National Statistics (ONS) and Land Registry house price figures, for August 2017, sparked fears of a two-speed economy, as it emerged that the only places to suffer this fate outside of Wales were in the north of England, analysis by housebuilding investment platform Homegrown shows.

The most recent data gives us a clear picture of the devastating impact of the crash in the ten years since the start of the crisis on 9th August 2007 – the day when BNP Paribas froze three of its funds, suggesting that it could not value the sub-prime loans contained in the complex financial instruments on its books. Doomed Northern Rock chief Adam Applegarth later described it as “the day the world changed”.

Since then, house prices in Belfast, Hartlepool and Blackpool have suffered worse than anywhere else in the UK.

The average house price in the Northern Irish capital is now 43.7% lower than it was in August 2007, at just £120,351. Hartlepool has also failed to recover, with a 19.5% drop to an average value of £100,957, while prices in Blackpool are still 16.4% down, at an average of £105,057.

Even Liverpool and Newcastle – two of the cities centred in the idea of the Northern Powerhouse – never recovered. Liverpool is still 1.7% down, with an average house price of £126,862, while Newcastle is 1% down on ten years ago, at £162,876.

A stark north-south divide means that properties in the North East are still worth 5.6% less than they were a decade ago, while the North West is struggling with growth of just 5.5% over the past ten years.

Meanwhile, London, the South East and South West are 62.7%, 37.7% and 19.2% higher on average respectively.

Bradford, Oldham, Lancaster and Falkirk only just escaped lost decades of house price growth, recovering their ground to finish just £1,039, £1,765, £235 and £196 higher on average in the last decade respectively.

The Founder of Homegrown, Anthony Rushworth, says: “This is two-speed Britain in action. It’s now clear that great swathes of the UK have suffered terribly in the aftermath of the financial crash, while areas in high demand have shrugged it off and surged ahead.

“We are too reliant as a country on a small number of densely populated areas, particularly in London and the South East. The technology exists to take a much more balanced approach to where Britons live and work.”

He continues: “The Northern Powerhouse promised exactly that, but it will take more than a marketing campaign by one chancellor to really shift the balance and create a more stable property market for future generations.”

Landlords, do you own property in one of the locations that have failed to recover to pre-crisis levels? How has this affected your investment plan?