Quarter of all Stamp Duty Paid from Ten Boroughs

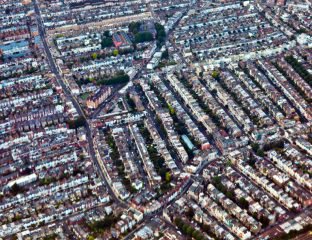
Over a quarter of all Stamp Duty collected in 2014-15 was paid in just ten southeast boroughs, contributing almost £2 billion to the Treasury.
The Stamp Duty changes in December 2014 have boosted the amount paid by those buying the most expensive homes, but the data from HM Revenue & Customs (HMRC) uses the previous thresholds to make easier annual comparisons.
The figures show that increasing house prices and a rise in the amount of sales pushed up the yield from Stamp Duty by 16%, to £7.5 billion. Sales in London accounted for £3 billion of the total and around £2 billion came from just ten areas in and around the capital.
Highest Stamp Duty yields
|
Position |
Local authority | Yield |
Percentage of UK residential yield |
| 1 | Westminster | £487m | 6.5% |
| 2 | Kensington and Chelsea | £451m | 6% |
| 3 | Wandsworth | £180m | 2.4% |
| 4 | Camden | £163m | 2.2% |
| 5 | Hammersmith | £135m | 1.8% |
| 6 | Barnet | £116m | 1.5% |
| 7 | Richmond upon Thames | £116m | 1.5% |
| 8 | Lambeth | £109m | 1.5% |
| 9 | Elmbridge | £93m | 1.2% |
| 10 | Islington | £91m | 1.2% |
In Westminster alone, £487m was collected from Stamp Duty, accounting for 6% of all residential sales.
Nearby Kensington and Chelsea was not far off, with £451m paid by homebuyers. Outside of London, Elmbridge, including the upmarket suburb of Esher, received £93m in the tax.
However, some areas in the top ten are not traditionally considered upmarket, such as Lambeth and Hammersmith, but both of these boroughs yielded over 1% of the total.
The proportion of the total tax received in the top ten has dropped, from 28.3% to 25.9%, although they took more than £100m more.
When combined, the yielded tax from London and the South East was more than £1 billion higher than all other regions of the UK put together, accounting for 62% of the total.
The amount made from sales of properties costing £2m or more, or bought by companies, totalled £1.3 billion.
HMRC reports that there has been a change in where the majority of the money is coming from: “In 2014-15, nearly 47% of residential SDLT (Stamp Duty Land Tax) revenue came from property transactions under £500k compared to about 64% in 2006-07.
“This is partly due to the higher tax rates on higher value property but also suggests the high value end of the housing market was less affected by the 2007-08 market crash.”1
The data highlights the growing divide between the London and South East property markets and the rest of the UK. Read more about this widening gap here: /house-price-gap-between-london-and-other-cities-widest-for-20-years/
Separate price figures from Savills indicate that the top end of the market has been hit by the Stamp Duty reform, with prices dropping on homes that face the greatest rise in tax.
Properties costing £2m or move have experienced price declines fairly in line with the increase in tax. For homes costing between £2m-£3m, prices have fallen by 1.1%, on those costing £3m-£5m, they are down by 2.4% and on properties worth £5m or move, prices have dropped by 4.7%.
Contrastingly, prices in the range of £500,000-£1m, where buyers face lower charges, have risen by 3%.
Head of Residential Research at Savills, Lucian Cook, says the prime London market “now looks fully taxed and buyers are slower to commit”.
He continues: “For all but the very best in class properties, many buyers are expecting a discount on last year’s prices at least equivalent to the additional tax.
“By contrast, Stamp Duty changes have benefitted properties in lower tiers of the prime market, which have performed more strongly.”1
1 http://www.theguardian.com/money/2015/sep/30/quarter-of-all-stamp-duty-comes-from-10-boroughs