Posts with tag: house price growth

House Prices Will Fall by 1% in 2017, Predicts Countrywide

Published On: August 22, 2016 at 8:50 am

Author:

Categories: Property News

Tags: ,,,,

House prices are expected to fall by 1% in 2017, according to the latest predictions from property firm Countrywide.

Today’s report also forecasts that house price growth will slow to 2.5% across the UK this year, but will recover to 2% in 2018, following next year’s decline.

Countrywide believes that house price growth will slow across all regions of the UK in 2016 and 2017, with recovery expected to begin at the end of next year and into 2018.

London is expected to see price growth slow to 3.5% this year, ahead of a 1.25% decrease in 2017 and a recovery to 2% in 2018. The firm predicts that prime central London will be the hardest hit, with price growth forecast to fall by 6% in 2016, rising to 0% in 2017 and 4% in 2018.

Across the south and East of England, price growth is also expected to slow in 2016, followed by small declines in 2017, before returning to positive growth in 2018.

Price growth in the South East will ease to 3.5% in 2016, down from 9.6% in 2015 and fall to -1% in 2017, according to Countrywide. The firm forecasts a similar path for house prices in the East and South West, as prices adjust to weaker economic conditions and previous strong growth.

House Prices Will Fall by 1% in 2017, Predicts Countrywide

House Prices Will Fall by 1% in 2017, Predicts Countrywide

Weaker economic conditions are also expected to hit prices in the north, Midlands and Wales.

Countrywide predicts that price growth will drop to 0.5% in 2016 and -0.25% in 2017 in the North East. Price growth in the North West, Yorkshire and the Humber, Wales and the Midlands is also expected to slow over 2016. Next year is also likely to see small declines too, as uncertainty surrounding the EU referendum impacts investment and labour markets, despite the support of a weaker currency.

The vote to leave the EU has unsettled the UK economy, Countrywide reports, as uncertainty surrounding the arrangements for Brexit affect trade and future economic growth.

The firm forecasts a weaker economy, which will hit house prices and property sales through consumer confidence, household incomes and the labour market.

Although this is not the only factor affecting the path of house prices, it says. Higher Stamp Duty rates are continuing to take their toll on the top end of the market, and after years of double-digit house price growth, expectations of future capital gains have weakened in many areas, leading to reduced demand.

However, the report adds that the continuing lack of housing supply and very low mortgage rates will remain a supportive factor for house prices. Putting its predictions into context, Countrywide expects prices to return to levels seen in the first quarter of this year.

Nevertheless, it points out that there are higher than usual risks at this time, given the nature of the challenges facing the country. The firm says that future house price growth will be dominated by the UK’s negotiations with the EU. It believes an orderly exit is in the interest of the remaining EU members and global economies – this gives some room for an upturn to the forecasts.

The Chief Economist at Countrywide, Fionnuala Earley, comments: “Forecasts in the current environment are trickier than ever, as the vote to leave the EU has thrown up many risks. Our central view is that the economy will avoid a hard landing, which is good news for housing markets. However, the weaker prospects for confidence, household incomes and the labour market mean that we do expect some modest falls in house prices, before they return to positive growth towards the end of 2017 and into 2018.

“Not all of the corrections are due to the vote to leave the EU. Stamp Duty and weaker house price growth expectations, particularly in London’s prime markets, have a part to play. There are supports to prices on the supply side from the continuing mismatch of supply. On the demand side, ultra low interest rates and the significant discounts available to overseas buyers, resulting from the fall in sterling, will help to support prices too.”


UK Property Market Resilient to Brexit Jitters, Reports ONS

Published On: August 16, 2016 at 10:45 am

Author:

Categories: Property News

Tags: ,,,,,

The UK property market proved resilient to Brexit jitters in the month of the vote, according to the latest House Price Index from the Office for National Statistics (ONS).

The average UK house price rose by 8.7% in the year to June 2016, up from 8.5% in the 12 months to May, continuing the strong growth recorded since the end of 2013, found the study.

The report, compiled using Land Registry data, reveals that the average UK house price in June – for which the most recent figures are available – was £214,000, up by £17,000 on June 2015 and £2,100 higher than the previous month.

UK Property Market Resilient to Brexit Jitters, Reports ONS

UK Property Market Resilient to Brexit Jitters, Reports ONS

The main contributor to the increase in UK property prices was England, where values rose by 9.3% in the 12 months to June. The average house price in England is now £229,000, compared to £145,000 in Wales, which saw an annual increase of 4.9%, and £143,000 in Scotland, where prices were up by 4.6% over the year. The average property value in Northern Ireland was just £123,000 in June.

Regionally, London continues to boast the highest average house price in England, at £472,000. Behind are the South East, at £309,000, and the East of England, at £270,000. The lowest average house price in England continues to be found in the North East, at £124,000.

However, the East of England has replaced London as the region with the highest annual house price growth, with values rising by 14.3% in the year to June. Despite this, growth in London remains high, at 12.6%, followed by the South East, at 12.3%. The lowest annual growth was seen in the North East, where prices were up by just 1.5% in the past year.

The most expensive place to live in England as of June was Kensington and Chelsea, where the average home costs a whopping £1.2m. Contrastingly, the cheapest area to buy a property was Burnley, at just £75,000.

The Senior Economist at PwC, Richard Snook, comments on the data: “These figures only capture one week of market activity after the vote to leave the EU on 23rd June, so it is too early to draw any firm conclusions from this set of data.

“Nevertheless, we expect that the vote to leave the EU will have a significant impact on the housing market. In our main scenario, average UK house price growth will decelerate to around 3% this year and around 1% in 2017. Cumulatively, our estimates suggest average UK house prices in 2018 could be 8% lower than if the UK had voted to stay in the EU.”

The founder and CEO of eMoov.co.uk, Russell Quirk, also looks at how the Brexit will affect the UK property market: “The latest data from the blended ONS and Land Registry indices shows no Brexit impact in June to the UK property market.

“Nationally, house prices are £17,000 higher than in June of last year and up more than £2,000 when compared to pre-Brexit. However, the two-month reporting lag of this particular indices means the drop in prices reported by Halifax at the start of the month is unlikely to come to the surface until July’s indices.

“Regionally, the capital is still king of UK house prices, at £472,204 on average, but it’s interesting to see the East of England has overtaken London with the highest rate of annual growth, of 14.3%, 1.7% higher than London.”

Quirk believes: “This could be an early indicator of foreign investment fleeing the capital pre and post-referendum result, although, that said, we’ve seen property demand in prime central London plummet to record lows over the last year. This is evidently becoming clear now in terms of property values, with both Kensington and Chelsea and Hammersmith & Fulham in the top five for the poorest performance in terms of annual growth, with values down 6.2% and 3.2% respectively.

“Newham still flies the flag for London as the fourth highest local authority district in terms of annual growth, up 21.4% over the year. So the capital and the UK as a whole are still looking rather robust where the state of the property market is concerned.”

Has the Property Market Lost Steam?

Published On: August 5, 2016 at 9:51 am

Author:

Categories: Property News

Tags: ,,,,

The latest Halifax House Price Index reports that the average UK house price has dropped by 1% over the past month, following the Brexit vote. But does this mean that the property market has lost steam?

Between June and July, the average house price in the UK fell from £216,726 to £214,678 – a slight decline of 1%. However, prices in the three months to July are still 8.4% higher than in the same period of 2015.

Additionally, prices in the past three months were 1.6% higher than in the preceding three months. This is above June’s 1.1% increase, and similar to the rates of growth recorded in April and May (both 1.5%), but significantly lower than in February and March.

Has the Property Market Lost Steam?

Has the Property Market Lost Steam?

However, the annual rate of growth, 8.4% in the three months to July, is unchanged from June, and is the lowest level since July 2015.

While house prices fell between June and July, following a 1.2% increase in June, Halifax claims that monthly changes can be erratic and falls often occur within an upward trend. Although this was the third monthly decline seen this year, it was lower than February’s 1.5% decrease.

The Housing Economist at Halifax, Martin Ellis, comments on the data: “House prices in the three months to July were 1.6% higher than in the previous quarter, up from 1.1% in June, but comfortably lower than earlier in the year. The annual rate of growth was unchanged at 8.4%; the lowest since July 2015.

“There are signs that house price growth is slowing, with a deceleration in both the annual and quarterly rates of increase in the past few months. Nonetheless, the current rates remain robust.”

He adds: “July’s monthly decline largely offsets June’s increase. The month-on-month changes, however, can be erratic and falls often occur within an upward trend. Overall, it remains too early to determine if there has been any impact on the housing market as a result of June’s EU referendum result.”

Halifax has also recently released its First Time Buyer Review. The report found that the number of first time buyers increased by around 10% in the first half of the year, compared with the same period in 2015.

There were an estimated 154,200 first time buyers in the first six months of 2016, compared with just 140,500 in the first half of last year. This was more than double the market low recorded in the first half of 2009 (72,700), but is almost a fifth lower than ten years ago, in 2006.

In response to the latest figures, the founder and CEO of eMoov.co.uk, Russell Quirk, comments: “This is the first full damage assessment of the UK property market by Halifax since Britain hit the Brexit iceberg back in June.

“Although it would seem the UK property market has lost steam since the vote, with prices dropping 1% since last month, the summer period is always a traditionally slower time of year for residential property transactions.”

He continues: “With prices still up 8.4% year-on-year, there’s no real evidence that UK homeowners need to jump ship just yet, and so I would urge them to remain calm and avoid any rash decisions.

“Once the market picks back up in a couple of months’ time and the Brexit uncertainty starts to subside, I’m confident the previous upward trend in value enjoyed by UK homeowners will continue.

“In the meantime, this slight slowdown in price growth, coupled with yesterday’s rate cut by the Bank of England, make it an ideal time for those considering a property purchase to strike while the iron is hot. Or slightly cooled in this case.”

How have London’s Olympic boroughs faired post 2012?

Published On: August 2, 2016 at 9:46 am

Author:

Categories: Property News

Tags: ,,,

With the Olympics in Rio just days away, a residential property crowdfunding platform has looked at how property prices in London have changed since the Games 4 years ago.

According to Property Partner, the six Olympic boroughs used during the London Games have outperformed the majority of others local authority areas in the capital.

Investment

The investigation found that major financial investment has driven property prices up by an average of 64% in the six boroughs during the period. Hackney, Newham, Barking and Dagenham, Greenwich, Tower Hamlets and Waltham Forest performed better than the still healthy 52.8% house price rises recorded in the capital’s 32 boroughs.

Waltham Forest received the gold medal, recording house price growth of 76% in the last four years. Hackney took the bronze, with growth of 66.9%, while Newham was squeezed out of the medal positions with 62.6%.

Non-Olympic borough Lewisham took the silver medal with house price growth of 67.9%.

How have London's Olympic boroughs faired post 2012?

How have London’s Olympic boroughs faired post 2012?

Legacy

Dan Gandesha, CEO of Property Partner, said, ‘London 2012 was the catalyst for a flood of investment into the capital, much of which was injected into regenerating some of the capital’s most disadvantaged boroughs. The economic legacy of the Games-supporting new jobs and skills, encouraging trade, inward investment, tourism and improved transport links-has meant a corresponding rise in house prices in the six host boroughs. The economic, social and environmental gap between these boroughs and the rest of London is closing.’[1]

‘Over the next few years, the capital will further benefit from significantly infrastructure projects-particuarly Crossrail where areas that were relatively inaccessible will suddenly be on London’s doorstep. In turn, like the Olympic effect, house price around Crossrail’s 40 stations are continuing to see an upward trend despite post-Brexit uncertainty,’ he continued.[1]

Concluding, Gandesha noted, ‘The reality is, no one can say for sure what will happen just now. But the fundamentals of the capital’s housing market are self-evident – demand far outstrips supply, which is further exacerbated by population growth and low borrowing costs. Moreover, the Bank of England is likely to reduce base rates even further in the very near future.’[1]

[1] http://www.propertyreporter.co.uk/property/olympic-boroughs-continue-to-outperform-other-areas.html

Highest London House Price Growth Under Thatcher and Blair

Published On: July 26, 2016 at 8:39 am

Author:

Categories: Property News

Tags: ,,,,

The highest London house price growth occurred when the country was under Margaret Thatcher and Tony Blair, according to new analysis from estate agent Stirling Ackroyd.

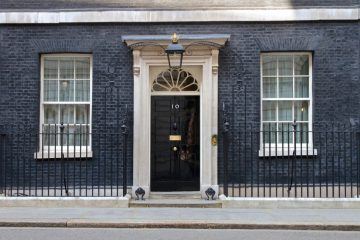
Recently, we looked at what the new Prime Minister, Theresa May, will mean for the housing market: /will-theresa-mays-government-mean-housing-market/. However, it is expected that the Brexit could mar her time as PM.

A spiralling market

The average London home cost just £31,370 in 1979 when Margaret Thatcher entered 10 Downing Street. Just 11 years later, this had soared to £110,110 – a whopping rise of 251%. For each year that Thatcher was PM, house prices in the capital grew by an average of 12.1%.

But Thatcher isn’t alone in overseeing a spiralling London property market.

Highest London House Price Growth Under Thatcher and Blair

Highest London House Price Growth Under Thatcher and Blair

Tony Blair’s time as PM saw the average house price in London surge from £108,620 in 1997 to £335,040 just ten years later, putting him in second place. During his term, London house price growth averaged 11.9% per year.

The Managing Director of Stirling Ackroyd, Andrew Bridges, says: “With great power comes great responsibility, but there’s one thing the PM can’t control – London house prices.

“Under Thatcher’s tenure, the property market was turned on its head – seeing dramatic house price growth in London. There’s always talk of spiralling house price growth in the capital, but compared to the 1980s, the rate of growth is lagging behind.

“Even the boom years under Blair couldn’t keep up with this pace of growth. Under New Labour, London’s property market reached new heights and became a global competitor. As demand soared, so did prices. Places like Shoreditch became solid investments and a buy-to-let surge started, with those properties snapped up still returning a profit today.”

Recessions bite

For PMs that governed during a recession, it’s been a very different story. House prices in London fell by 1.4% between Thatcher and the end of John Major’s term. In 1991, the average home in the capital cost £110,110, falling to £108,620 at the time Major left office. However, financial difficulty prevented buyers from taking advantage of the drop in house prices.

Similarly, Gordon Brown, who inherited a sharp global recession, also oversaw negative house price growth during his time as PM. When he entered No. 10 in 2007, a typical London home cost £335,040. By 2010, property had become more affordable, at £332,720.

One of the world’s most expensive cities

David Cameron’s time as PM saw the price of a London home increase by 53%, as the capital became a safe-haven for international property investors. In 2010, buyers paid £332,720 for the average home, rising to £507,880 this year.

Bridges concludes: “Buyers in London have paid the price under Cameron’s leadership. House prices started rising swiftly again, and, despite a return to strong economic growth, affordability has become the number one issue for Londoners. Once again, the supply of homes could not keep up with demand and economic growth.

“If the pattern developing over the last 38 years is anything to go by, Theresa May could face a static London property market. The City’s property sphere has been pushed to its limits with new legislation and political events in the last. But there’s a new advantage – London’s property market is more resilient and probably the safest real estate investment globally. The comparisons of May and Thatcher have already begun – but London’s property market can be tamed by no one.”

Annual House Price Growth Plateaus in June

Published On: July 22, 2016 at 8:35 am

Author:

Categories: Property News

Tags: ,,,,

Annual house price growth plateaued in June, at 10.2%, the same level as May, but still ahead of the 6.9% rise recorded in June last year, according to the latest Hometrack UK Cities House Price Index.

Bristol remains the fastest growing city in the UK for house prices, with a yearly inflation rate of 14.7%. However, annual house price growth in London and other cities in the south of England, such as Cambridge, Southampton and Bournemouth, started to slow between May and June.

Annual House Price Growth Plateaus in June

Annual House Price Growth Plateaus in June

In contrast, large cities in northern parts of the UK, such as Glasgow, Manchester, Liverpool and Leeds, have recorded strong growth over the past quarter, due to more affordable house prices, lower interest rates, improving local economies and higher rental yields, making purchases particularly attractive to landlords.

Following the UK’s vote to leave the EU, attention has turned to the impact of Brexit on the economy and property market. However, time lags mean that official data is slow to pick up on changes to housing. The final pre-Brexit house price data, from the Land Registry, found that house prices have risen by 8.1% annually.

The Hometrack data, which covers recent market activity up to the middle of July, shows changes in the balance of supply and sales, providing an early insight into whether housing supply is starting to expand, which could in turn reduce price growth.

In the three months to mid-July, sales momentum in regional cities and higher house price growth appear to have remained steady. However, the headwinds facing the London market ahead of the EU referendum on 23rd June have resulted in a rise in supply and relatively fewer sales, indicating that house price growth may slow in the coming months.

Hometrack also found that new property listings have grown faster in the last three months than the average for the past year. For all cities in England and Wales, excluding London, new listings have increased 10% faster than the 12-month average, rising to over 15% in the capital.

In contrast, an 8% relative fall in sales was seen in London over the last three months, compared to the 12-month average. Sales in Bristol did not change over this period, while sales growth has been positive in larger regional cities, at up to 7% in Manchester.

The Insight Director at Hometrack, Richard Donnell, comments: “The headwinds that were facing the London market in the lead up to the EU referendum have intensified on the back of the vote to leave, and are resulting in slower sales rates. It is still early days, and seasonal factors also need to be considered, but the growth in new listings and slower sales points to slower price growth in the months ahead. This growth in supply reflects a mix of new homes filtering through from London’s expanded development pipeline, investors looking to take capital gains, or selling to de-leverage their investments following the reduction in tax relief on mortgage payments for buy-to-let investors.

“In contrast, in many large regional cities, sales appear to have held up, thanks to a combination of much better housing affordability, improving economic growth and record low mortgage rates helping to stimulate demand.”

He concludes: “The reality is that it is still very early days to assess the true impact of the Brexit vote on the housing market. Our view remains that sales volumes are likely to slow and price growth will moderate over the second half of the year. The severity of a slowdown will depend upon the response of consumers and businesses to the uncertainty created by the decision to leave the EU and the impact this has on the economy. The early market activity data confirms our view that London will bear the brunt of any slowdown.”