Written By Em

Em

Em Morley

Annual Rent Price Growth Drops for First Time in Eight Years

Published On: June 6, 2017 at 9:48 am

Author:

Categories: Property News

Tags: ,,,,

Annual Rent Price Growth Drops for First Time in Eight Years

Annual Rent Price Growth Drops for First Time in Eight Years

Annual rent price growth across the UK dropped for the first time in almost eight years in May, according to the latest Rental Index from HomeLet.

The data shows that the average rent price on a new tenancy commencing in May was £901 per month – 0.3% lower than in the same month of 2016.

Rents on new tenancies in London were also 3% lower than in May last year, at an average of £1,502 – the greatest decline for eight years.

This is the first time since December 2009 that the HomeLet Rental Index has recorded a fall in rent prices on an annual basis.

The rate of rent price growth across the UK has been slowing in recent months, having peaked at 4.7% last summer.

The Chief Executive of HomeLet, Martin Totty, comments on the figures: “May 2017 saw average rents nationally fall for the first time in eight years, when the economy had suffered the shock of the financial crisis.

“HomeLet rental data suggests landlords are now facing a difficult balancing act between ensuring rents are affordable for tenants in a low real wage growth environment, whilst covering their own rising costs.”

He continues: “Tenants will still need a vibrant and growing rented sector to provide them with property options at the time of their choosing. Any constraint to the supply of rental properties, because landlords are unable to achieve the reasonable returns they require, cannot be in the long-term best interests of tenants, especially if, as we’ve now heard from all the main political parties, the UK’s population continues to grow.”

Here’s how rent price growth has varied across the UK:

Region

Average monthly rent – May 2017 Average monthly rent – April 2017 Average monthly rent – May 2016 Monthly variation

Annual variation

East Midlands £614 £604 £595 +1.6% +3.3%
North West £679 £677 £664 +0.2% +2.2%
South West £803 £802 £787 +0.2% +2.1%
Wales £605 £610 £594 -0.8% +1.8%
East of England £909 £904 £904 +0.5% +0.6%
Northern Ireland £609 £614 £606 -0.9% +0.4%
West Midlands £658 £661 £656 -0.5% +0.3%
Yorkshire and the Humber £614 £619 £618 -0.7% -0.6%
South East £998 £1,003 £1,014 -0.4% -1.5%
Scotland £622 £632 £634 -1.6% -1.9%
North East £522 £525 £534 -0.7% -2.3%
Greater London £1,502 £1,519 £1,548 -1.1% -3.0%
UK £901 £904 £904 -0.3% -0.3%
UK excluding Greater London £753 £754 £750 -0.1% +0.5%

Are you still considering who to vote for in Thursday’s (8th June) General Election, online estate agent eMoov has analysed which political party has been best for the property market since 1970: /best-political-party-house-price-growth/

Hannah Maundrell, the Editor in Chief of money.co.uk, also comments on the HomeLet statistics: “Tenants have been bashed by rising rents for years, so signs the sharp rises may have subsided will come as welcome relief for anyone looking to move. Not least because the surprise slowdown is the exact opposite of what we expected would happen following the tax changes that cropped profits for many buy-to-let landlords.

“The slowdown may sound like good news, but it comes after years of steep hikes that have left rent unaffordable for many. It’ll be interesting to see how the rental market fares post-election, as all of the larger parties have made bold pledges over the housing market.”

She continues: “While some may take the slowdown as proof the economy is about to take a turn for the worst, this may not necessarily be the case. It’s true that inflation is starting to hit pockets and that skyrocketing rents has made life difficult for many. However, this could simply be the market evening out; the demand for rental property is certainly still there.

“On the plus side, this does shift the power away from landlords slightly and give tenants a little more negotiation power on price if they’re looking to move to a new property or renew their contract.

“Taken together with the slowdown in car and retail sales, it’d be easy to paint a bleak picture; but we have to remember that sales exceeded expectations in the first quarter and at the end of last year. So much so, the Bank of England became very worried about consumer spending and debt. There’s only so much money we can spend; it’s quite possible these figures are a reflection of the fact we’ve already made our big purchases for the year.”

Number of rental properties in UK continues to fall

Published On: June 6, 2017 at 9:32 am

Author:

Categories: Property News

Tags: ,,,

Another report has suggested that the number of properties coming onto the privately rented market is continuing to fall.

This in turn is serving to drive up rents across many regions of the UK – particularly in market towns.

Fall in Landlords

This fall in housing supply can be attributed to the lack of new landlords bringing new stock onto the market, according to Belvoir – one of Britain’s largest letting agents.

Chief Operating Officer of Belvoir, Dorian Gonsalves, feels that the decline in property coming onto the market is directly due to the recent changes in legislation – such as increases in Stamp Duty and alterations to mortgage interest tax relief.

Gonsalves observed: ‘As a result of this stock shortage, properties are often rented to the highest bidder, typically the wealthier tenant, which is raising rents beyond the traditional plus or minus four to five percent trend.’[1]

Number of rental properties in UK continues to fall

Number of rental properties in UK continues to fall

Increasing Rents

Belvoir’s Q1 rental index, compiled by property expert Kate Faulkner, indicates that the firm’s offices have seen average rents rise by 5.75% year-on-year. This was a rise from £728pcm in Q1 2016 to £770pcm in Q1 2017 – driven by gains in parts of the East Midlands and Yorkshire.

Rents ranged from £602pcm in the North West, £655pcm in the East Midlands, £842pcm in the South West and £1,440pcm in London.

In addition, the report indicates that 43% of tenants are staying put in their properties for between 13-18 months. 29% stay between 19-24 months and 18.2% rent for over 2 years.

Worryingly, void periods are seemingly on the increase with 60% of properties taking up to two weeks to be let.

Concluding, Mr Gonsalves said: ‘Despite increases in rents in some regions, rent arrears are not increasing, suggesting that tenants are currently coping with landlord rent rises.’[1]

[1] https://www.landlordtoday.co.uk/breaking-news/2017/6/number-of-rental-homes-coming-on-market-falls-sharply


[1]

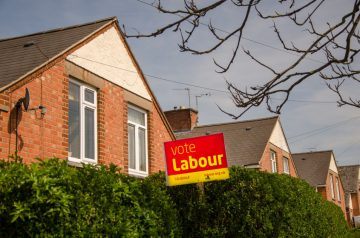
Trade Union Backs Labour in Election as House Price to Earnings Ratio Hits 8.2

Published On: June 6, 2017 at 9:13 am

Author:

Categories: Property News

Tags: ,,,,

Trade union GMB has backed Labour in Thursday’s (8th June) General Election, following its pledges to build more council homes, after research showed that average house prices in England have hit 8.2 times typical earnings.

Trade Union Backs Labour in Election as House Price to Earnings Ratio Hits 8.2

Trade Union Backs Labour in Election as House Price to Earnings Ratio Hits 8.2

The analysis by the London division of the GMB, based on Land Registry house price figures and Office for National Statistics (ONS) earnings data, showed that in the East of England, the average house price in March 2017 was £277,127, which is a huge 9.2 times the average full-time earnings for the area, of £30,000.

The situation was worst in Three Rivers, where average house prices are 15.9 times typical wages, followed by 15.1 in Hertsmere, 13.6 in Cambridge, 13.4 in St Albans and 12.9 in Epping Forest.

Across England as a whole, house prices were 8.2 times average earnings.

Warren Kenny, the London region secretary of GMB, insists that these statistics show that voters should back Labour in the General Election, due to its pledges to build one-million homes in the next parliament – half of which would be council houses.

Kenny explains: “GMB London region analysis of average house prices to average earnings in the East of England shows that the aspirations of working people on average earnings and below to own their own homes is no longer achievable.

“The Labour Party election manifesto pledges to build one-million homes in the next parliament, with half of them council housing. These figures show that more council homes for rent in all council areas are absolutely essential.”

He urges: “GMB is calling on the electorate in the East of England to get behind their Labour Party candidates in the area to realise this manifesto commitment.

“We have been talking about this problem for far too long. There can be no excuses for not providing housing to people that they can afford to live in on average wages.”

If you’re still contemplating who to vote for, this analysis by eMoov shows which political party has been best for house price growth since 1970: /best-political-party-house-price-growth/

North East property prices steady before election

Published On: June 6, 2017 at 8:47 am

Author:

Categories: Property News

Tags: ,,,

The most recent analysis from Keep It Simple has revealed that property prices in the North East have remained almost unchanged in the run up to the General Election.

Data from the report shows that prices in the region fell by only 0.2% over the course of the last month.

North East Property

A typical property in the North East region is valued at £166,125 – £441 less than at the end of April. House price values in the area had risen by 1.9% in April, after sliding by 0.1% in both February and March.

Average regional property values are 5.8% greater than they were last year, with the typical property value £9,150 greater in May 2017 than 2016.

8 of the 20 regions covered by the report experienced price rises – with strong performances recorded in Easington, Peterlee and Houghton-le-Spring. Prices in these regions rose by 2.2%, 1.6% and 1.5% respectively.

Rent Falls

Rents in the North East dropped to an average of £576 pcm in May – a fall of just £9. What’s more, these values are just £2 per month lower than in May 2016.

Rental yields remain unchanged, with investors in the region continuing to enjoy returns of 4.2%. This is higher than the average yield recorded in London, which presently stands at 3.2%.

Easington is the cheapest place to rent in the region, at just £385 per month. On the other end of the scale, Tynemouth is the most expensive, with rents here averaging at £1125pcm.

North East property prices steady before election

North East property prices steady before election

Waiting Game

Ajay Jagota, founder and Managing Director of Keep It Simple, observed: ‘I predicted four weeks ago was that we would see little change in house prices this month with both buyers and sellers adopting a ‘wait and see’ outlook ahead of next week’s General Election – and so it has proved.’

‘What will be fascinating to see is whether this week’s result releases some pent up energy, pushing prices up. This is certainly what happened in 2015, when North East property prices rose by 4.8% in the two months after the General Election,’ he continued.[1]

Assessing the impact of the election, Mr Jagota said: ‘A hung Parliament or slim majority could have the opposite effect, but what’s really striking about our figures is how resilient they show the North East property market to have been over the past 12 months, despite the uncertainty of Brexit and another General Election.’

‘Prices are currently almost 6% higher than they were twelve months ago, adding more than £9000 to the value of the average property. In the case of Blyth, it’s nearly 13% and £15,000 higher.’

‘With rents practically unchanged in the same period, dare I say that the North East property market is strong and stable – good news for both the many and the few,’ he continued.[1]

[1] http://www.propertyreporter.co.uk/property/north-east-house-prices-strong-and-steady.html


[1]

Which has been the Best Political Party for House Price Growth Since 1970?

Published On: June 6, 2017 at 8:12 am

Author:

Categories: Property News

Tags: ,,,,

Ahead of Thursday’s (8th June) General Election, online estate agent eMoov.co.uk has taken a look at which political party has been the best for house price growth since 1970.

The agent analysed historic house price data to determine which majority government – Labour or Conservative – has had the greatest impact on house price growth per year during their reigns across all 650 parliamentary constituencies.

When the Conservative government first took power in June 1970, the average UK house price was just £4,508. Almost half a century later, and today’s Conservative Government oversees a very different economic landscape. In the past 47 years, house prices have surged by 4,724.80% to the current average of £217,502.

But despite the Conservatives currently overseeing a housing crisis – caused by their inability to build the homes needed to meet buyer demand – historically they aren’t the best party for UK homeowners who want to see the values of their properties climbing. This, in fact, is the Labour Party, which has seen house price growth of 16.62% per year of its reign, to the Conservative’s 15.14%.

House price growth since 1970 

Conservatives: 1970-1974 

Which has been the Best Political Party for House Price Growth Since 1970?

Which has been the Best Political Party for House Price Growth Since 1970?

During the Conservative’s initial majority government, led by Edward Heath, house prices rose by 120.23% – 30.06% for each of the four years, which is the largest rate of growth per year to date.

Labour: 1974-1979 

Labour then governed over a slightly lower rate of price growth across a similar timeframe, split between Harold Wilson and James Callaghan, with prices up by 92.14% between 1974-1979 – an increase of 18.43% per year.

Conservatives: 1979-1997 

A Conservative government then followed for 18 consecutive years, first led by Margaret Thatcher, who saw house prices rise by 187.91% between 1979-1990, before John Major ruled the next seven years, pushing the total price increase under the Conservatives to 206.18% – the highest total growth since 1970, but an average of just 11.45% a year.

Labour: 1997-2010

Under the 21-year reign of Tony Blair and Gordon Brown’s Labour governments, the total increase in house prices hit 192.53% – a rise of 14.81% per annum.

Conservatives: 2010-now

In the past seven years, under a Conservative majority government, house prices have increased by just 27.31%, as the market has slowed from the extreme rates recorded over the last three decades. This equates to an average increase of just 3.90% per year.

Highest and lowest growth under Labour 

The constituencies to have seen the slowest rate of house price growth under Labour since 1970 are Airdrie and Shotts, Coatbridge, Chryston and Bellshill, and Motherwell and Wishaw. All three are located north of the border in Scotland and all have seen price growth of just 13.56% under Labour governments.

The highest growth was seen in North Down in Northern Ireland, at 24.59%, with the top ten highest constituencies under a Labour government all located in Northern Ireland.

Highest and lowest growth under the Conservatives

The constituency to have recorded the lowest house price growth per year under a Conservative government is Pendle in the North West – up by just 8.39%.

Since 1970, the top ten lowest constituencies for annual house price growth under a Conservative majority government are all located in the North East or North West.

Somewhat expectedly, the constituency to have seen the greatest annual rate of house price growth under a Conservative government is Kensington, at 33.87%. In fact, the top 125 constituencies to have recorded the highest rates of house price growth are all located in London, the South East or East of England.

The Founder and CEO of eMoov, Russell Quirk, comments on the findings: “This research really isn’t trying to highlight that one party is better than the other, but more which party is better for the UK populace, depending on their current residential situation.

“All the major parties have attempted to address housing in the run-up to this month’s election, but have outlined very little other than the usual empty promises on building and which, let’s face it, has historically ensured a rapidly rising rate of house price growth in itself. One wonders whether successive governments have purposely sought to strangle housing supply to encourage value growth and therefore a tail wind of voter enthusiasm for their particular political colour at successive elections?

“Therefore, we thought it important that both buyer and seller alike have something else to base their decision to vote on, that was at least based on fact, albeit historical evidence.”

He continues: “If you are in the privileged decision of owning a home in the UK, Labour is the party to ensure your bricks and mortar assets continue to appreciate. If you are a struggling aspirational buyer, then on the face of it the Conservatives are marginally better where a lower rate of price growth is concerned and to better enable you a foothold on the property ladder.

“Of course, the UK picture will vary drastically when considering individual constituencies, so we would suggest looking at the wider data set to see how the two differ in house price performance for your local area.”

Rise in use of letting agents could be unsustainable

Published On: June 5, 2017 at 11:21 am

Author:

Categories: Landlord News

Tags: ,,,

A recent rise in the number of landlords using letting agents to help manage their property may not be sustainable, according to a new report.

Last week saw research from the National Landlords Association reveal that 61% of landlords currently use a letting agent – a 7% increase from the final quarter of 2016.

Abnormal

The increase was described as a break from the norm by the National Landlords Association, with the proportion of landlords using an agent remaining relatively consistent during the last few years.

In addition, the report found that the proportion of landlords self-managing their property has slipped by nearly 10% during the last year.

Richard Price, executive director of the UK Association of Letting Agents, believes that the fact more landlords are relying on letting agents is testament to the service that many provide in the sector.

Mr Price said: ‘It is an uncertain time for anyone who owns a buy to let property, so the steady hand of a reputable agent is exactly what many landlords are looking for right now.’[1]

Rise in use of letting agents could be unsustainable

Rise in use of letting agents could be unsustainable

Changing Sector

However, recent changes in buy-to-let taxation, coupled with the proposed ban on charging fees to tenants, could mean a number of landlords will be searching for different ways to save money. This could see less landlords using services provided by agents.

Chief Executive of the National Landlords Association, Richard Lambert, observed: ‘As landlords plan ahead to compensate for the tax changes over the next few years we would expect to see the number who use an agent to slowly fall away, and for more to start considering whether they are able to manage their properties themselves.’[1]

[1] https://www.landlordtoday.co.uk/breaking-news/2017/6/rise-in-number-of-landlords-using-letting-agents-may-not-be-sustainable