Written By Em

Em

Em Morley

Tech-Savvy Tenants Pose Greater Risk to Letting Agents than Regulation, Journalist Claims

Published On: April 27, 2018 at 8:54 am

Author:

Categories: Lettings News

Tech-savvy tenants are posing a greater risk to traditional, high street letting agents than the heaps of regulation that is expected to drive them out, according to City A.M journalist Katherine Denham.

Denham’s feature, which can be accessed here, says that the danger posed to letting agents is not going to be increased regulation of the sector, but the tech-savvy tenants that are renting their properties.

The journalist pictures a future where there will be agents charging the wealthiest tenants a high fee in return for a top class service.

“At the same time, the number of online agents like Purplebricks will rise to reach the mass market,” she believes.

Denham adds that the lettings industry seems “blinkered to the dangers, underestimating the threat posed by thriving online businesses, and millions of tenants who are fed up with paying over the odds to get little in return”.

She continues: “There’s a generation of renters who may not be able to afford to buy a house, but who are not prepared to put up with unprofessional letting agents forever.

“And, while some agents are upping their game in response, many aren’t doing themselves any favours and show little interest in trying to win over this generation.”

She insists: “Really, it’s not the imminent rules that letting agents should be panicking about. It’s tech-driven millennials who could well be the death of this industry.”

Denham, who says that some letting agents are “reliably awful”, believes that the sector is “oblivious to the peril it is facing”.

She notes that it has made little effort to make amends over the past decade: “The bad reputation is still exacerbated by hefty letting fees that are hidden within complicated structures.

“Property agents have a reputation for milking people out of money… it’s an experience that anecdotally seems widespread.”

The journalist claims that banning tenant fees and forcing agents to sit exams are welcome proposals.

She highlights that these changes mimic those that have reformed the financial advice sector. The Retail Distribution Review sparked a decline in the number of financial advisers, allowing online advice services to fill the gap, being cheaper and faster.

“You can see the property agent industry heading in the same direction,” she concludes.

Landlords, do you believe that tech-savvy tenants, rather than new regulations, will drive out traditional letting agents?

Almost 70,000 First Time Buyers have Benefitted from Stamp Duty Relief

Published On: April 27, 2018 at 8:22 am

Author:

Categories: Property News

A total of 69,000 first time buyers have benefitted from the Government’s Stamp Duty relief for this type of purchaser, according to new figures published by HM Revenue & Customs (HMRC).

The total value of these savings was £159m, with almost half of the Stamp Duty relief being granted on home purchases in London and the South East of England.

HMRC claims that these figures are “broadly in line” with the Chancellor’s projections, which were announced in last year’s Autumn Budget, along with details of the relief.

The average first time buyer saved £2,300 on the purchase of their home. Not surprisingly, the greatest savings were experienced in London, with first time buyers in the capital saving an average of £4,300.

Northern Ireland had the lowest average saving, of £800.

Almost 70,000 First Time Buyers have Benefitted from Stamp Duty Relief

Almost 70,000 First Time Buyers have Benefitted from Stamp Duty Relief

In total, 19% of all first time buyer transactions were in the South East, while 13% were in London.

The majority of these first time buyer purchases were for properties priced under £300,000. However, in London, four out of ten first time buyers (42%) using the Stamp Duty relief were purchasing properties priced between £300,000-£500,000.

This is the first time that HMRC has included this information in its quarterly Stamp Duty report. These figures, however, cover the period from 22nd November 2017 until the end of March 2018 – when the change was introduced.

The Chancellor brought in the Stamp Duty relief for the majority of first time buyers purchasing properties up to the value of £300,000. For those buying homes worth up to £500,000, a reduced rate will apply.

HMRC’s data shows that there was a slowdown in housing transactions in the first quarter (Q1) of the year.

Quarterly sales fell from 333,500 in Q4 2017 to 267,000 in Q1 2018, a decline of 20%.

Residential transactions fell by 21%, to 238,000 from the previous quarter.

HMRC says that the seasonal nature of the housing market means that Q1 figures typically have the fewest transactions. However, it pointed out that this is still the largest quarterly decrease since 2014/15.

Standard rate transactions fell across all price bands, as did additional property sales, on which the higher Stamp Duty rate is applied.

Mark Hayward, the Chief Executive of NAEA Propertymark (the National Association of Estate Agents), comments on the announcement: “This is really welcome news; first time buyers have traditionally been the most vulnerable buyers operating in the market, but today’s figures indicate that the Stamp Duty relief is starting to make an impact.

“From December 2017 to March this year, sales to the group were up to 29% on average, compared to 27% for the same period the year before. While this is indeed an upward swing, sales haven’t rocketed. This could be because first time buyers are now thought to be holding off on making purchases – typically outside of London – opting instead to save for longer to maximise the full Stamp Duty relief.”

He continues: “The other reason is that the cost of buying is still very high, and first time buyers are still finding it difficult to save for their deposit. As the cost of living continues to rise – with consumer price inflation standing at 2.3% in March – we still have a long way to go to make the dream of owning a home accessible to all, but this is definitely a step in the right direction.”

Housing Affordability is Officially Worsening across England, Reports the ONS

Published On: April 27, 2018 at 8:10 am

Author:

Categories: Property News

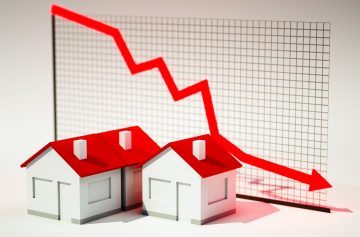
The Office for National Statistics (ONS) has published a Housing Affordability report covering the period 1997-2017, which indicates that affordability is officially worsening across England.

In 2017, full-time employees could typically expect to spend around 7.8 times their workplace-based annual earnings on buying a home in England and Wales, for which the report covers. This is up from an affordability ratio of 7.6 in 2016, which is a rise of 2.4% between 2016-17. This change was driven largely by the declining housing affordability in England, where the ratio increased from house prices being 7.7 times annual earnings in 2016, to 7.9 in 2017, which marks a rise of 2.5%.

There were no significant changes in the ratio of median house prices to median annual earnings in Wales between 2016-16. The latest year that the affordability ratio was substantially different from 2017 in Wales was in 2007, therefore, affordability has only significantly changed over a ten-year period.

Housing affordability worsening at quicker rate in flats and newly built properties

In 2017, detached properties were the least affordable homes in England and Wales, whereas terraced houses were the most affordable.

Flats and maisonettes have seen the largest change in housing affordability over time in both England and Wales, but the rise was larger in England (141.5%) than in Wales (85.8%). This is likely to reflect the influence of increasing prices for flats in London, which has driven the largest growth in England overall.

The affordability of terraced properties has seen the second largest change in England, but has experienced the smallest change in Wales. This is because the increase in the median price paid for terraced houses in Wales (201.4%) is smaller than the increase for terraced properties in England (283.1%) between 1997-2017.

Last year, full-time employees in England and Wales could expect to spend 9.7 times their median gross annual earnings on buying a newly built home. Purchasing an existing dwelling in England and Wales in 2017 was significantly more affordable, with house prices of existing homes being on average 7.6 times earnings.

Areas with higher prices do not always have higher wages

In 2017, the Royal London Borough of Kensington and Chelsea was the least affordable area to purchase a property in England and Wales, both when workplace-based and residence-based earnings were taken into account. It had the highest ratio of median house price to median workplace-based gross annual earnings, with house prices being 40.7 times earnings. House prices in the borough were 28.9 times residence-based earnings last year.

Kensington and Chelsea had the highest median house price in 2017, of £1.3m, but it was more affordable for residents of the borough, who may not necessarily work there, rather than for employees in the borough who may not necessarily live there.

Copeland, in the North West of England, was the most affordable local authority in 2017, both when workplace-based and residence-based earnings were used. It had the lowest ratio of median house price to median workplace-based gross annual earnings, with house prices being 2.7 times earnings.

Housing Affordability is Officially Worsening across England, Reports the ONS

Housing Affordability is Officially Worsening across England, Reports the ONS

House prices in Copeland were 3.0 times residence-based earnings in 2017, therefore, it was more affordable when workplace-based earnings were used to calculate the housing affordability ratio. This means that it was more affordable to purchase a property in Copeland if you worked there but may live elsewhere, than for those who live in Copeland, but may not work there.

Although Copeland was the most affordable local authority in England and Wales, it does not mean that this local authority had the lowest house prices or the highest earnings; rather it has the highest earnings in relation to house prices.

There is a positive correlation between the median price paid for a home and the median gross annual salary. This means that, generally, the higher the earnings of a local authority’s employees, the higher the house prices. However, not all local authorities follow this trend.

Buying a home in Kensington and Chelsea was relatively less affordable in 2017 compared to all other local authorities. For those working in the borough, the median gross annual salary was £31,950, whilst the median house price was £1.3m. With median house prices being around 40 times the median gross annual earnings, it suggests that income from other sources, in addition to employee earnings, would contribute towards affording to live in these areas. However, homeowners in Kensington and Chelsea may work in other areas where earnings are higher, which is reflected by the residence-based earnings being higher than workplace-based earnings.

Copeland, on the other hand, has a relatively high median annual salary and a relatively low median house price, making it fairly affordable to own a property there. The median annual salary was £47,221, which is in the highest 1% of all local authorities, whereas the median house price was £128,000, which falls in the lowest 10% of local authorities. In Copeland, there are a large number of relatively high paid, skilled jobs at the Sellafield nuclear power station, which could partly explain why properties appear more affordable in this area.

House prices driving worsening affordability in the South East and East

Between 2016-17, there were two regions in England and Wales that had significant changes in the ratio of median house price to median workplace-based annual earnings. The East of England experienced an increase in ratio of 7.8%, from 9.0 in 2016 to 9.7 in 2017. The South East had a rise of 5.1%, from 9.8 to 10.3 over the same period. All of the regions in England and Wales witnessed an increasing ration and, therefore, worsening housing affordability over the year, except for the North East and Wales, although only the South East and East had significant changes.

House prices and earnings rose in all English regions and Wales over this period, but the two regions with the largest increase in house prices (the East, at 10%, and the South East, at 6.9%) were the two regions with the significant differences over the year. This suggests that house prices are driving the substantial worsening in housing affordability.

Earnings increased for all regions and Wales, but to a smaller extent than house prices in many regions, with the largest rise being around 2.9% in London. There were two areas in which the percentage change in earnings was greater than the percentage change in house prices, and these areas therefore had improving housing affordability. These were the North East and Wales, however, these changes in affordability were not significant.

House prices were up in 94% of the local authorities in England and Wales between 2016-17, with 206 local authorities witnessing growth of 5% or more. All local authorities in the East and the South East of England experienced a rise in house prices.

Housing affordability worsened the most in London over five years

There were 69 local authorities in England and Wales that had significant differences in the ratio of median house prices to median workplace-based annual earnings over the five years between 2012-17. Over three-quarters of these local authorities were in London, the South East and the East of England. There were no significant differences found over this timeframe in the North East or Wales.

In 2017, of the ten least affordable local authorities, seven were in London. All but five London boroughs had a significant worsening in housing affordability since 2012.

The London Borough of Barking and Dagenham had the largest percentage increase in the affordability ratio, meaning that this local authority has worsened the most in housing affordability over the last five years. This predominantly resulted from a 77.3% increase in median house prices since 2012.

From 2006-16, Barking and Dagenham was the most affordable local authority in London, however, the affordability ratio has increased steadily over time and has become less affordable than Tower Hamlets in 2017.

Shaun Church, the Director of mortgage broker Private Finance, comments on this report: “The latest housing affordability figures paint a worrying picture for those hoping to make their first step onto the housing ladder. Traditional first time buyer homes – flats, maisonettes and terraced houses – have witnessed the largest negative change in housing affordability. As the demand for starter homes has soared, construction has halted – pushing the prices far beyond the reach of many hopeful homeowners.

“The Government is taking a proactive approach to helping first time buyers, with schemes such as Help to Buy. However, with new build affordability worsening at a much faster rate than other property types, questions must be asked about whether schemes with an exclusive focus on new builds are over-inflating prices and will distort the market even further in the long-term?”

He continues: “While the price of entry to homeownership in the UK has soared to almost unreachable heights, the cost of owning property has declined significantly. Back in 1997, homeowners faced interest rates of 6.25-7.25%, which have since fallen to record lows of 2.5-0.5% over the last decade. Mortgage finance has become far more affordable and, as house prices climb, this continues to be the one aspect of the market currently working in homeowners’ favour.

“With a rate rise rumoured to be just around the corner, borrowers should consider locking in to the favourable rates currently on offer. The next rise may only be incremental, but with housing affordability continuing to decline, a good mortgage deal will help make the eye watering cost of UK property that bit more manageable.”

Number of Tenants Experiencing Rent Rises Increased in March

Published On: April 26, 2018 at 9:26 am

Author:

Categories: Tenant News

The number of tenants experiencing rent rises increased to 23% in March, according to the Private Rented Sector Report for last month, from ARLA Propertymark (the Association of Residential Letting Agents).

Demand from tenants 

The study also found that the amount of prospective tenants registered per ARLA Propertymark member branches rose by 8% in March. In February, agents had an average of 61 renters on their books, compared to 66 last month.

This follows an increase in January, which saw the number of tenants registered per branch jump to 70.

Supply of rental stock

The number of rental properties managed per member branch grew marginally in March, from an average of 175 in February to 179 in March.

This is down year-on-year, as March 2017 saw an average of 183 properties managed per branch.

Rent rises 

Number of Tenants Experiencing Rent Rises Increased in March

Number of Tenants Experiencing Rent Rises Increased in March

The amount of tenants experiencing rent rises increased to 23% in March. This is the highest level seen since September 2017, when 27% of landlords put rent prices up for tenants.

This figure is down annually, however, as March 2017 witnessed 25% of tenants experiencing rent rises, while 32% were subject to increases in March 2016 and 2015.

We remind all landlords thinking of putting their rent prices up to consider how their tenants’ finances will be affected. Rent Guarantee Insurance is the ultimate peace of mind cover to ensure that landlords still get paid if their tenants can’t. Get instant protection online here.

David Cox, the Chief Executive of ARLA Propertymark, comments: “This month’s results very much show a business as usual period for the private rented sector, but this isn’t necessarily a good thing. Supply is still too low and almost a quarter of tenants are experiencing rent hikes every month, as landlords try to recoup the costs lost trying to keep on top of all the recent legislative changes – including the recent energy efficiency deadline.

“For the last two decades, successive governments have passed significant amounts of complex legislation for landlords, none of which have been properly policed or adequately enforced, but most of which cost decent landlords a lot of money.”

He explains: “This is why we’re so supportive of the Government’s proposals to crack down on rogue agents and, more recently, plans to confiscate properties from criminal landlords. The announcements mark a sensible shift towards focusing on the root cause of the issues affecting the sector, rather than trying to find solutions to individual problems. This, coupled with greater rental stock, is the key to fixing Britain’s broken rental sector.”

Burnham Announces Amnesty for Rogue Landlords

Published On: April 26, 2018 at 9:14 am

Author:

Categories: Landlord News

An interesting addition to the on-going issue of what to do about the UK’s rogue landlords has come from Greater Manchester Mayor Andy Burnham. He has proposed an amnesty to drive rogue landlords out of the region’s private rented sector.

The Mayor spoke at the Residential Landlord Association’s ‘Future Renting North’ conference on Tuesday, stating his plans to buy properties not up to standard from landlords who are unwilling to make the necessary changes. He has said that they have no place in Greater Manchester.

Burnham’s assertiveness may well pave the way for a spring clean of the rental property industry.

He made use of the conference in order to flesh out his plan to introduce a Good Landlords Scheme in the region. This scheme will provide landlords with a set of principles that they can subscribe to in order to prove that they are committed to providing a set standard of service and accommodation.

Although the plans are at an early stage of development, the Mayor has said that he believes they have the capacity to transform renting in the region.

He told the landlord audience that by attending the conference they have proven their commitment to making changes and striving to provide a good service for their tenants.

No punches were pulled by Mr Burnham, as he said that there are still too many bad landlords out there and that things need to change to tackle what he described as the “epidemic of insecurity”.

He stated: “Safe, decent housing should be a human right as healthcare and education are.

“The fact that you are at the conference today shows that you want to be reputable and do things properly. Truth of the matter is this doesn’t apply to the whole of the private rented sector.

“We need to isolate those that are giving the sector a bad name.

“We will work with you to establish what’s reasonable, what’s fair and what landlords should be expected to provide.”

He followed this by announcing his plans for the amnesty for private landlords who don’t give adequate care to or invest in their properties.

Speaking out after this speech, the Mayor said that he could not yet give details of what the buy-out package would be.

When questioned about whether he might be deemed to be rewarding bad landlords by offering them market prices for their properties, he replied: “Who said anything about market values?

“However if people want to exit the market we will facilitate that.”

The Mayor said he plans to reveal a new housing policy in June, with a rough timescale of 12-18 months for the Good Landlord Scheme to be implemented.

Average UK rents decrease for first time since 2012, according to The DPS Rent Index

Published On: April 26, 2018 at 8:05 am

Author:

Categories: Lettings News

Average rent in the UK decreased for the first time since 2012 during the first quarter of 2018, The Deposit Protection Service (DPS) has revealed.

The DPS has collected data from millions of properties across England, Wales, Scotland and Northern Ireland over the past decade. It’s found that the average UK monthly rent during the first quarter (Q1) of 2018 was £772. This latest version of its Rent Index, has found this means the average monthly rent is £4, or 0.54%, less than the last quarter of 2017 (£776).

The DPS also says that if rents remain unchanged or there is another decline in Q2 2018, the UK will experience its first annual rental decrease since the end of 2009.

Julian Foster, Managing Director at The DPS, said: “The decrease in average rents across the UK could represent the beginning of a substantial development for the housing sector and a significant indicator for understanding the wider economy.

“Rent growth began to slow in summer 2016, and the slip into negative figures suggests that there is a genuine long-term issue affecting the private rented sector.

“The UK-wide decrease implies that there is more at play than a short-term or local correction to excessive prices, and a similar reduction in Q2 could represent the first annual decrease in rents since 2009.”

Average UK rents decrease for first time since 2012, according to The DPS Rent Index

Average UK rents decrease for the first time since 2012

Some key findings of the report are summarised below.

The main regions of the UK that experiences the biggest decreases in average rent:

  • Northern Ireland experienced the biggest percentage decrease of any UK region, of 3.14% (or £17) from £544 to £527, replacing the North East as the most affordable UK region in which to rent property.
  • As a region London saw an £18 decrease in average rent (falling 1.39% from £1,325 to £1,307). This makes it the largest fall in value of any UK region and the second consecutive quarterly decrease for the capital.
  • As a proportion of salary, rents decreased by 0.18%. This equates to rent prices taking up 32.63% of a salary, to 32.45%. These figures were obtained with the most recent data for average wages available, from 2017.

Only four UK regions experienced growth in average rent:

  • Wales, which experienced the biggest growth at 3.62% (£21 from £573 to £594).
  • The South East at 1.01% (£9 from £870 to £879)
  • East Midlands at 0.45% (£3 from £599 to £602)
  • North West at 0.18% (£1 from £594 To £595)

In terms of the type of rental property, such as flats, family houses, terraces, every type of property became cheaper on average to rent. Flats experienced the biggest decrease of the quarter, of 1.2% – £10 from £796 to £786.

The Index was developed by Professor of Global Economy, Joe Nellis, who was jointly responsible for the research and development of the UK’s leading house price measurement systems, the Halifax and the Nationwide House Price Indexes, and Catarina Figueira, Professor of Applied Economics and Policy, both of Cranfield School of Management.